Market Overview: NASDAQ 100 Emini Futures
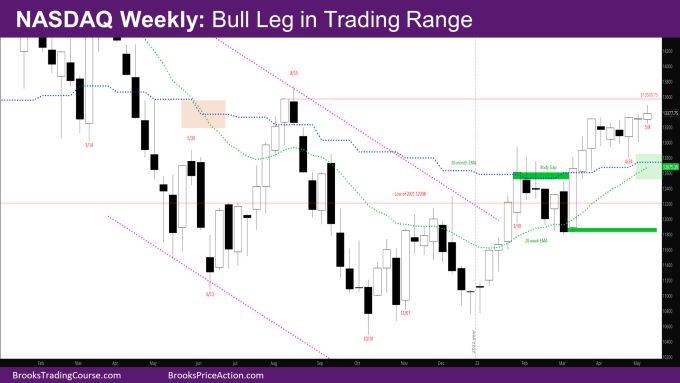
The NASDAQ Emini futures ended the the week as a Nasdaq 100 bull leg with a doji bull bar and long tail above, closing just above last week’s high.
The price action for the past few weeks looks like an expanding triangle – a new high, followed by a low – week of 4/24, followed by a new high. So, when it reverses, it can go below the low of 4/24.
NASDAQ 100 Emini futures
The Weekly NASDAQ chart

- There is not much new this week.
- The bulls again did the minimum of having a bull close above last week’s high.
- The bears did their part of producing a tail on the top.
- As mentioned above, the market is likely creating an expanding triangle, which when reverses should go below the prior low of 4/24.
- It maybe like the opposite of what happened in October, as well as last May and June.
- The next bull target is the close of Week of 8/8 at 13569.75 – the last bull bar of the micro channel up in August. That was a reasonable buy the close bar, and there are trapped bulls up there.
- The market is close enough to this target that it should reach it.
- The first bear target is the bottom of week of 4/24 – 12800.
- There is also a body gap created by the week of 1/30 – There has not been a bear close after the market broke above the close of 1/30 that overlaps with the body of 1/30.
- The next target for bears will be to close the body gap by going below close of 1/30 – 12613.25
- The weekly exponential moving average (EMA) is getting close to the monthly EMA (shown by the green shaded region on the chart)
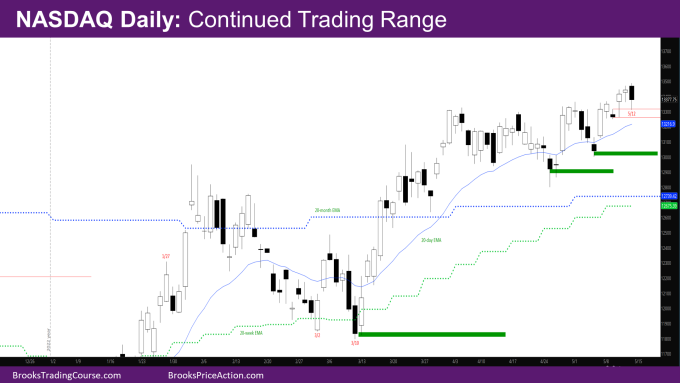
The Daily NASDAQ chart

- Friday was a big outside down bear day with a big tail at the bottom.
- The market rallied in the last 2 hours on Friday to help put a weekly close above last week’s high.
- Monday was a bull follow-through bar to the big bull bar last Friday. It showed that the market was accepting the big bull bar from Friday.
- The market gapped down on Tuesday and closed as a small bear bar near Monday’s low. This was a surprise.
- Wednesday gapped up much higher, which was another surprise. The market then sold off to Tuesday’s low letting the bears out and then closed higher, producing a big tail below.
- Thursday was a trading range bull follow-through bar to Wednesday, with a close just below Wednesday’s high.
- It looks like the low of Friday was to the high of the Tuesday bear bar, allowing the bears who sold above the Tuesday bear bar to exit.
- This price action shows that even though the market is going higher, it is a bull leg in a trading range as breakout body gaps are closing.
- When there is a bigger pullback, some of the possible targets and areas of support are shown in the chart.
Market analysis reports archive
You can access all weekend reports on the Market Analysis page.

