Market Overview: NASDAQ 100 Emini Futures
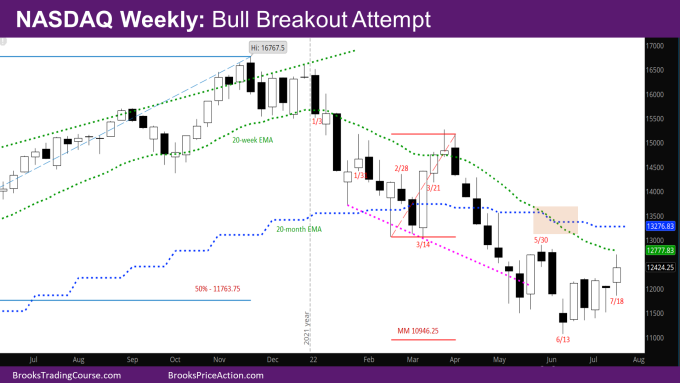
NASDAQ 100 bull breakout attempt above the tight trading range (TTR) that has been going on for the last 4 weeks. The week closed with a bull body, but a big tail at the top and bottom.
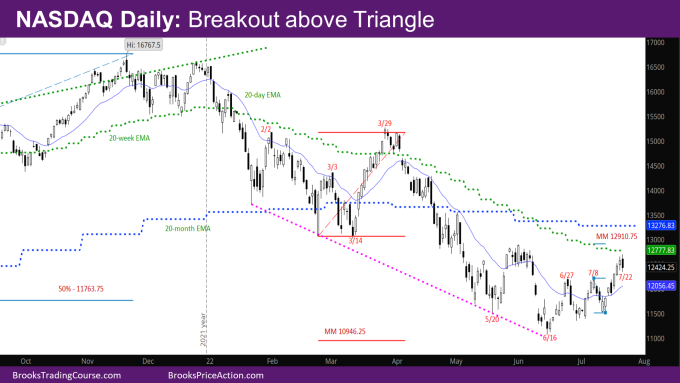
We have been saying for a couple of weeks now that prices should go higher in the next few weeks, up to the weekly exponential moving average (EMA). The market has broken above the triangle on the daily chart, and based on the measured move (MM) of the range, the market should go above the weekly EMA as well as near the last swing high at 12899.25. At that point, the market will decide what to do next based on whether sellers come in at the weekly EMA.
We also said in last month’s report that July should be a bull or doji bar. As of now, July is a good bull bar with a tail at the top. It should close out the month next week with a bull body, although will likely have a big tail on the top to disappoint the bulls.
NASDAQ 100 Emini futures
The Weekly NASDAQ chart

- This week’s Nasdaq Emini candlestick is a bull bar with big tail at the top and bottom. This is a reminder of trading range price action.
- The bulls are disappointed because they couldn’t close the week on the high. The bears are disappointed because they allowed the bulls to breakout above the tight trading range and close with a bull bar.
- There is a five-week bull micro-channel – the low of each of the past five weeks is higher than the week before. This means that there should be a second leg up, even if small.
- The market is close to the weekly EMA and should go above it. Somewhere between the weekly and monthly EMA, bears would like a double top bear flag with the May swing high.
- The bulls would like to close strongly above the weekly EMA. At least, they would like to close the body gap with the bars in April.
- The tail at the top of this week is a reminder that this is likely a minor reversal, and bulls will need another good bull buy signal as followed the bear bar of 6/13.
The Daily NASDAQ chart

- Friday’s NQ candlestick is an outside bear bar.
- The daily chart had been in a triangle for the past three weeks – the bulls making higher lows, and the bears lower highs. The market broke out above this triangle on Tuesday and had follow-through days on Wednesday and Thursday.
- The measured move (MM) target of the breakout of this range is 12910.75, which is above the weekly EMA and above the last swing high at 12899.25.
- The bear bar on Monday was a good chance for the bears to force a reversal again near the top of the triangle. However, the bulls broke to the upside.
- One could look at the market as having made three pushes up since the June low, but the most recent leg is strong enough that there will likely be another leg up.
Market analysis reports archive
You can access all weekend reports on the Market Analysis page.

