Market Overview: NASDAQ 100 Emini Futures
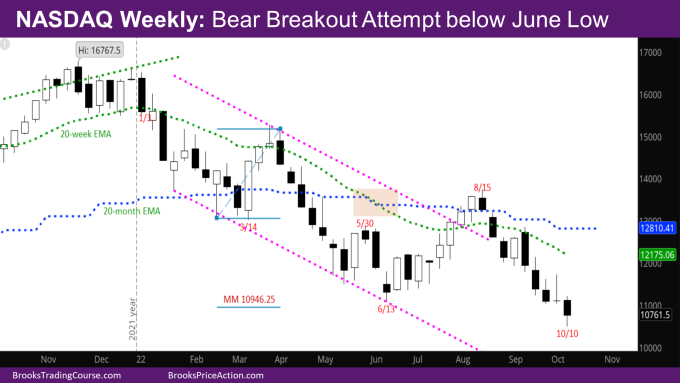
The NASDAQ Emini futures market is attempting a Nasdaq 100 bear breakout below the June low. It fell far below the prior June low this week and closed far below it as well, although with a tail below. Last week’s bar was a doji with a big tail above. This shows buyers buying below and sellers selling above.
The market also made the target at the measured move (MM) down of the February-March double bottom (DB) on monthly chart at 10946.25, mentioned in the reports for the past few months.
Given how far the market has fallen below the June low, there will be sellers above last week and around the weekly exponential moving average (EMA) if the market goes up in the next few weeks. Likewise, bulls will buy below this week and scalp. The market could go sideways to the weekly EMA by creating an expanding triangle (ET)/triangle in the next few weeks.
NASDAQ 100 Emini futures
The Weekly NASDAQ chart

- This week’s Nasdaq candlestick is a bear bar closing below the midpoint with a tail at the bottom.
- The bear leg down since 9/12 is strong – open gaps, no bull bars, and no overlap of body.
- Since the market has gone far below the MM target mentioned above, the next set of targets for bears are –
- The August monthly bar was a credible Low 1 Sell Signal bar. Assuming a 40% chance of success, a 2x target based on size of the August bar would be at 9261.
- The August monthly bar as a double-top (DT) bear flag with May high, with the neckline around July low, and a MM down would be between 9000-9200.
- If the October month is a good bear bar, the probability of the above targets will be 60%.
- The September monthly report had mentioned that the ES (S&P 500 Index futures) has yet to reach the bottom of its bull spike in November 2020 around 3300. And if the ES gets there, then likely the NQ will fall alongside.
- The ES would have to fall another 8% from this week’s close to reach 3300. An 8% drop of the NQ from this week’s close would be around 9886. At this point, this is a realistic target.
- Bulls would like the market to go sideways to up to the Weekly EMA around 12161 and falling.
The Daily NASDAQ chart

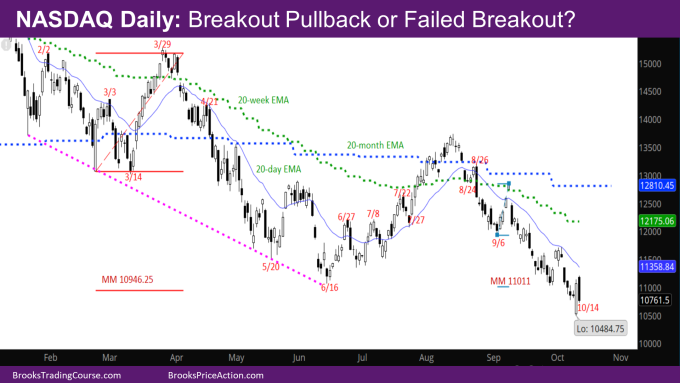
- Friday’s NQ candlestick is a big bear trend bar reversing half of Thursday’s big bull bar.
- The market made the MM of the right shoulder shown in the chart at around 11011.
- The market gapped down big below the June low on Thursday, but ended up back close to the June low, creating a big bull bar. This shows limit order bulls buying below June made money.
- Big bars usually result in trading range price action – buyers below and sellers above.
- If Friday had been a follow-through bull bar, it would have been more positive for the bulls. However, Friday sold off from above Thursday’s high indicating that Thursday could more represent a pullback from a bear breakout below the June low than a failed breakout. This would mean sellers above.
- Just like bulls made money buying below June low, they will likely make money buying below Thursday.
Market analysis reports archive
You can access all weekend reports on the Market Analysis page.

