Will the stock market bears get a black swan event?
Updaated 6:51 a.m.
The Emini gapped up and had consecutive bull bars. It is therefore Always In Long. Yet, most days over the past month have had a lot of trading range price action. The odds are that this will be the same for today.
When there is a gap up and then bull trend bars, the Emini usually rallies for about 5 bars and then either pulls back to test the low and the moving average, or enters a trading range for an hour or more until it gets closer to the moving average. If it enters a trading range, the Emini would be in breakout mode. The probability would still slightly favor the bulls. Yet, the odds are against a strong bull trend day today.
Unless there is a parabolic wedge top or strong reversal down, the odds are against a bear trend day today. The Emini is currently deciding whether it will trend up or form a trading range.
Pre-Open market analysis
The Emini has been in a broad bull channel on the daily chart for 3 weeks. Because Friday was a bull bar after a pullback, it is a buy signal bar for today. Yet, it was a doji bar that followed 3 bear bars. Since that is good selling pressure, it increases the chances that there might be enough sellers above Friday’s high to make the Emini go sideways for a couple of days.
Last week was a sell signal bar on the weekly chart. Since the weekly chart is so extremely overbought, the odds favor a 100 point pullback beginning within weeks. If this week trades below last week’s low, it would trigger the weekly sell signal.
Yet, unless there is a big bear entry bar on the weekly chart, the odds are that the selloff will be a brief bull flag. Most attempts to reverse trends fail. This would likely lead to at least a little more up on the weekly chart.
Buy climax means increased risk of Black Swan event
The fundamentals strong, but the weekly chart is extremely overbought. The bears therefore are hoping for a Black Swan event. By definition, Black Swan events are rare. However, because the weekly buy climax is so extreme and likely to reverse soon, there is an increased chance of a surprise over the next few weeks.
The bulls want the trend up on the daily chart to continue. The next resistance is the 2500 big round number. While the weekly chart is extremely overbought, there is no sign of a top yet. This ongoing buy climax makes the Emini more susceptible to news events. The current news is about the Senate’s replacement of Obamacare and the hopes for tax reform. When there is a buy climax, even a minor story can be a catalyst for a big reversal down. However, climaxes can go a long way before they end, and there is no sign of a top yet. The odds favor higher prices, at least for a few days.
Overnight Emini Globex trading
The Emini is up 6 points in the Globex market. This is the end of the 2nd quarter and the week before the 4th of July. Both increase the odds of higher prices over the next week. If the Emini opens here, it will gap up. Since it is in a bull trend on the daily chart, this would be a buy entry on that chart.
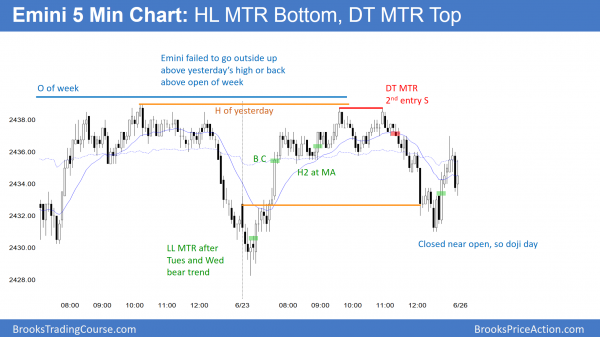
Yet, the past 2 days were dojis. Furthermore, the Emini has been mostly sideways with many dojis over the past month. Finally, it has been in a 5 day bear micro channel. These factors reduce the chances of a big trend day today. The bears hope that any rally this week reverses down around the all-time high from last week. For example, they want either a lower high or higher high major trend reversal.
When there is a gap open, there is an increased chance of a trend day up or down. While the odds slightly favor the bulls, the Emini has been mostly sideways over the past month. Hence, the most likely outcome today is another day with mostly trading range trading.
However, traders will pay attention to the price action over the 1st hour or two. If there is a series of trend bars or gaps up or down, the odds of a strong trend day will go up. Therefore, traders will swing trade part or all of their positions.
Friday’s setups
Here are several reasonable stop entry setups from yesterday.
EURUSD Forex market trading strategies
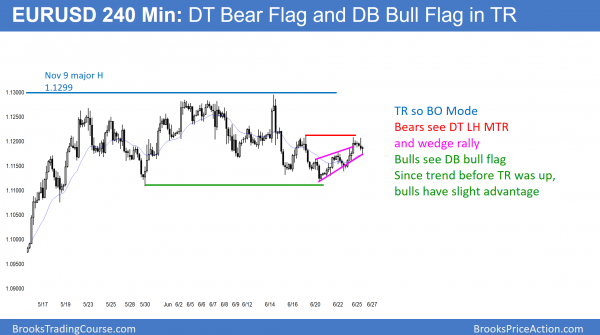
The 240 minute EURUSD Forex chart has been in a trading range for 6 weeks. Because the trend before the range was up, the bulls still have a slight probability advantage. Yet, once a trading range like this lasts more than 20 bars, the probability for the bulls and bears is both around 50%. The bulls have a double bottom bull flag, whereas the bears have a small wedge rally to a double top bear flag and double top lower high major trend reversal.
The EURUSD Forex market has been sideways in a 200 pip range for 6 weeks. It is therefore in breakout mode. This follows a 6 month rally in a 2 year range. Yet, that 2 year range is in a bear trend on the monthly chart. Because the May rally was so strong, the odds still favor a break above the November 9 major lower high. However, the bulls 1st need a strong break above last week’s lower high to end the bears hope of a successful double top lower high major trend reversal.
Overnight EURUSD Forex trading
The EURUSD Forex market rallied 40 pips in the past hour, and broke slightly above the June 19 lower high. If they can extend the breakout, the bulls will next try to break above the top of the 6 week range and the November 9 lower high.
If this breakout instead stalls over the next couple of hours, the bears will try to reverse the trend back down. Their hope for a double top lower high major trend reversal would still be valid. Since the 2nd high is now above the 1st, the probability is now less for the bear case.
The strength of this breakout over the next hour is important. If the rally is relentless and strong, then the odds are that the May bull trend is resuming.
Because the EURUSD market is in the middle of a trading range, it is more likely that the follow-through buying today will disappoint the bulls. Hence, the odds favor this being an extension of the 5 day bull leg in the trading range. Therefore, the odds favor a reversal into a bear leg in the trading range before a break above the 6 week range.
There is no sign of a top and the momentum up over the past hour is strong. Hence, the odds are either for more rally or a trading range today, and not a bear trend.
Summary of today’s S&P Emini futures price action and what to expect tomorrow
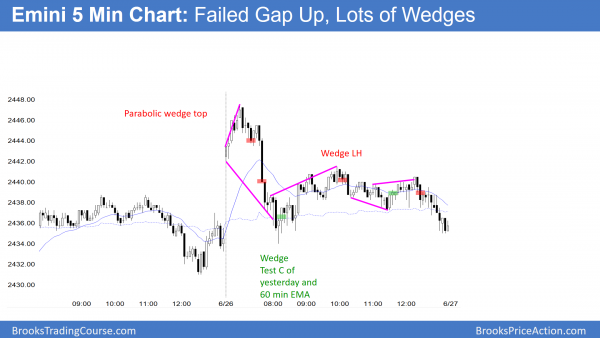
The Emini gapped up but then sold off from a small parabolic wedge. After a wedge rally up from the 60 minute moving average, it sold off slightly again.
Yet, the day was mostly a trading range day.
The Emini gapped up and reversed down, but had prominent tails. While it closed below its open and therefore was a bear trend day, it was mostly a trading range day. The Emini is therefore still waiting for a reason to break out of its month long range. Until there is a clear breakout, most days will continue to be mostly sideways.
See the weekly update for a discussion of the price action on the weekly candlestick chart and for what to expect going into next week.
Traders can see the end of the day bar-by-bar price action report by signing up for free at BrooksPriceAction.com. I talk about the detailed S&P Emini futures price action real-time throughout the day in the BrooksPriceAction.com trading room. We offer a 2 day free trial.
When I mention time, it is USA Pacific Standard Time (the Emini day session opens at 6:30 am PST, and closes at 1:15 pm PST). You can read background information on the intraday market reports on the Intraday Market Update page.


Al,
I’m curious. In the E-mini 5-min chart above, why wouldn’t you have marked a sell below bars #32 or #33 for a wedge test of #27,#31 vs delaying the sell until below bar #42 for the wedge test #31,#41. The first doesn’t make a scalp, the second does, but you don’t know that until after the fact. Shouldn’t both of them be marked with stops probably above bar #13 or the high of the day or am I missing something by taking the sell early at #32 or #33. Just wondering!
Thanks,
Bob
Hi Bob,
Al may answer later, but perhaps my input will suffice for now? These chart setup markups are not scalps, as Al is encouraging beginners in particular to wait for swing entries. Yes, you are right that scalps below #32/#33 look fine, but with market AIL at that point, as well as around a 50% pullback, the market is likely to go either sideways or continue up. Hence not a swing.
Just my 2 cents (not a lot in Hong Kong).
Hi BTC Admin,
Many thanks for your prompt reply. The #32/#33 entry could have also turned out to be a swing just as #42 actually did. My question probably is should one wait for so many bars between the final two wedge bars before it can be determined as a good wedge short or long entry. Just wondering.
Best, Bob