Posted 6:53 a.m.
The Emini began with limit order trading around yesterday’s close and in the middle of yesterday’s trading range. The bulls were hoping that yesterday’s late rally was the start of a 2nd leg up. The bears wanted another lower high in the bear channel that began early yesterday, and they want to close the gap below yesterday’s low. Trading ranges always have both bull and bear setups.
This early tight trading range trading, especially following yesterday’s trading range, reduces the chances of a strong trend day and increases the chances of a lot of 2 sided trading today. Bull and bear limit order scalpers have made money in the 1st several bars. There probably will be several tight trading ranges and at least one swing up and down.
Traders want a strong breakout up or down with follow-through. These early trading ranges often last a couple of hours before there is a breakout, and sometimes the breakout is brief. If there is a strong trend, traders will be more willing to swing trade. The odds are against a strong trend day.
Pre-Open Market Analysis
S&P 500 Emini: Weak price action in buy candlestick pattern
The Emini reversed up on Thursday from below the April low on the daily chart. Thursday was a doji and therefore a weak buy signal bar. Friday gapped up, but was a small bull bar that stalled at the 20 day EMA. This is not a strong reversal, and there is no sign that the trading range of the past 2 months is about to end. The Emini might continue mostly sideways into the FOMC meeting on June 14, which could result in a big move up or down.
The weekly chart is bullish. There was an 11 bar bull micro channel, and then a 4 week pullback. All 4 weeks were dojis and they were above the weekly EMA, which is more consistent with a bull flag than a bear reversal. Also, after 11 weeks without a pullback, the 1st reversal down is usually bought for a test of the top of the micro channel (which is the April high and the all-time high).
The bears hope that the 11 week rally is a buy climax and a higher high major trend reversal. The odds favor at least one more small push up before the bears can create a reliable reversal down. Less likely, the Emini can reverse down sharply. The bears need a strong move down to make the bulls give up, and the odds are against it without at least one more push up.
Friday’s trading range was also a relatively flat bear channel. A bear channel is a bull flag, especially after a strong leg up. The daily chart had a strong leg up that started on Thursday. The odds are that the bulls will try to get at least a small 2nd leg up early this week. The pullback from the Friday high might have more to go 1st. For example, it might close the gap below Friday’s low.
The Globex market is unchanged and it has traded sideways. Since Friday was mostly sideways, the odds of a lot of trading range trading are higher today.
Forex: Best trading strategies
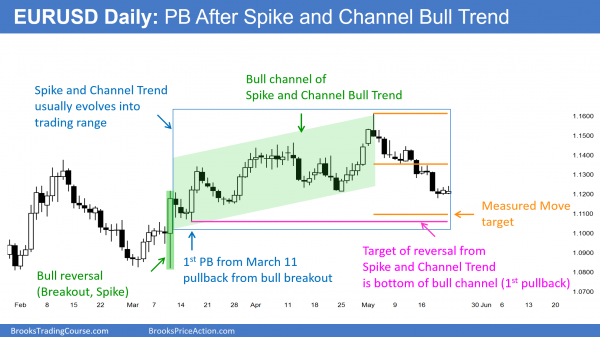
Reversal down from Spike and Channel bull trend might fall to measured move target and bottom of 1st pullback after strong reversal up (spike).
The daily chart of the EURUSD is correcting after a Spike and Channel Bull Trend. Bull channels usually evolve into trading ranges. The pullback is often to the bottom of the 1st pullback after the bull reversal (the Spike), and the EURUSD is close to that target. It is also close to a measured move target. Both are support areas, and the EURUSD can bounce at any time. This is especially true since the selloff has had several sell climaxes (big bear bars followed by small bull bars).
The selloff of the past 3 weeks on the daily chart is in a tight bear channel. That means that the 1st reversal up will probably be minor, and therefore only a bull leg in the trading range. There will probably be sellers above who will create a lower high. If is does bounce, it might retrace about 50% of the selloff. Bears will then begin to sell, betting on a Head and Shoulders top (the April 12 high would be the left shoulder). Trading ranges always have credible bull and bear patters. The bulls would see a double bottom with the March 16 pullback after the March 10 bull reversal (Spike).
Because the daily chart has fallen in a series of sell climaxes, it probably will bounce this week. With the FOMC meeting on June 24, the odds are that the trading range will probably continue up to the report. It might then have a big breakout up or down. Since the monthly chart has a double top bear flag at the 20 month moving average, the bears have a slight advantage. However, it might take many more months before the bears win, if they are to win. In the meantime, the bulls on the daily chart can continue to create legs up and down.
Since the daily chart is oversold and at support, it probably will try to bounce this week. There is still a measured move target below at around 1.1100, and the bounce might not come until after the measured move is tested. If it comes before and is not too strong, the measured move magnet might still draw the market down to it before the bulls can test up to the middle of the 2 month range.
If this selloff is a resumption of the bear trend on the monthly chart, it could fall relentlessly for several months. However, this strong selling is not yet present on the daily chart, and a trading range is more likely over the next few weeks.
Summary of today’s S&P Emini futures price action and what to expect tomorrow
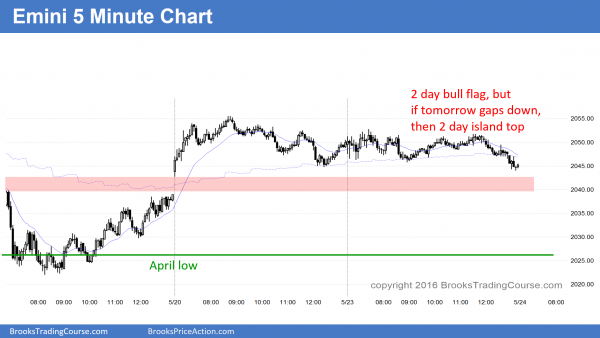
The Emini stayed in a narrow trading range until the final few bars when it sold off to the low of the day.
After trading in a tight range all day, traders got no new information. The bulls want a break above the daily moving average and above the 2 day bull flag. The bears want to close the gap below Friday’s low. The Emini is in breakout mode, which means that the probability of a profitable bull breakout is about the same as for a profitable bear breakout. Until there is a strong breakout, day traders will continue to scalp. With the Emini closing near its low, the bears have a reasonable chance to close the gap tomorrow.
If tomorrow gaps down, the gap will create a 2 day island top. However, island tops and bottoms in trading ranges are common and usually do not lead to trends. At a minimum, the bears would like another test of the April low. Since April is a sell signal bar on the monthly chart, the bears want May to close below the April low because that would increase the chances of at least a little more selling. However, the 11 week rally on the weekly chart makes a big selloff unlikely without a better top.
See the weekly update for a discussion of the price action on the weekly candlestick chart and for what to expect going into next week.
Traders can see the end of the day bar-by-bar price action report by signing up for free at BrooksPriceAction.com. I talk about the detailed S&P Emini futures price action real-time throughout the day in the BrooksPriceAction.com trading room, and a 2 day free trial is available.
When I mention time, it is USA Pacific Standard Time (the Emini day session opens at 6:30 am PST, and closes at 1:15 pm PST). You can read background information on the intraday market reports on the Intraday Market Update page.


Hi Al,
When calculating sell climaxes, do we label first spike as climax as well? e.g. on EU daily chart, is bear spike on 18 May a second or third climax?
Many Thanks
Every big bear bar or series of bear bars that is followed by a pause is a climax. May 18 was the 3rd.
Al,
I trade something close to your Always In style in which you recommend buying/selling above/below bars. Today was a tough day for me to make $$ with this style. Do you recommend adjusting styles to limit order buying/selling in situations like this or just halting trading? Or, should I just stick with it because the market will eventually find a wider range that will reward my style? Thanks.
Dave
I talked about this in the room today. Always In is a swing trading approach. From the 1st bar of the day and many other times today, I made the point that today was a limit order, scalping day. The bull and bear scalpers made money from the 1st few bars and this continued all day. I never fight the price action. I do not swing trade until there is a strong breakout and one side can no longer make money with limit orders.