Trump’s tariffs and congressional loss creating double top
Updated 6:43 a.m.
Today opened within yesterday’s 4 hour trading range. The bulls will try to form a higher low and an early reversal up from above yesterday’s low. They want the early selling to be a pullback after yesterday’s expanding triangle bottom.
They need a convincing early opening reversal before traders will conclude that yesterday’s bottom will lead to a bull trend. The early big bear bars reduce the chances of a strong bull trend day today. They increase the odds that the best the bulls will get in the 1st hour is a continuation of yesterday’s trading range.
The bears want a strong break below yesterday’s low. Since yesterday reversed up repeatedly with good buy signal bars, the odds are against it. More likely, this will be a trading range open, and the bulls will try to get an early low of the day.
Pre-Open market analysis
The Emini sold off strongly yesterday and then entered a trading range. There is a sell signal on the daily chart and a buy signal on the weekly chart. Confusion usually leads to a tight trading range. The Emini might go sideways into next Wednesday’s FOMC announcement.
The next two days will tell traders whether the weekly buy signal or daily sell signal is more likely to be successful. If the bears get a gap down today, it would create a 4 day island top. Alternatively, if today is a 3rd big bear day, it would be a sign of strong bears.
The bulls need a strong bull trend bar on the weekly chart this week. At the moment, that is unlikely. This is because the week is far below the week’s high and there are only 2 days left. Consequently, this week will be a sell signal bar on the weekly chart for next week.
The bears will see this week as a 2nd failed buy signal on the weekly chart. If this week closes on its low, the bears will sell next week if it trades below this week’s low. The odds would then favor the 3 month trading range continuing for at least several more weeks. As a result, moves up and down will probably continue to reverse.
A 3rd bear day would increase the odds of continued selling next week
Yesterday ended with a lower low major trend reversal and an expanding triangle bottom. While the past 2 days were big bear days, a bull day today would make it likely that they will just be a pullback from the breakout above the February 27 high.
The bulls need a bull day today. Hence, there is an increased chance of either an early selloff and a reversal up, or of a bull trend beginning early.
However, the bears want a 3rd consecutive bear trend day on the daily chart. This would significantly increase the odds that the double top on the daily chart is controlling the market. Traders would then look for a test down to the March 2 low within a couple of weeks.
Overnight Emini Globex trading
The Emini is up 4 points in the Globex market. Since the bears have been strong and they need 1 more bear day today, there is an increased chance of a selloff in the 1st 2 hours. If there is one, what follows will be important. Traders will look for a strong reversal up. If the bulls cannot create a strong reversal, traders will continue to sell all day.
Alternatively, since yesterday had a credible bottom, the Emini might rally from the open. If traders decide that the past 2 days were simply a pullback from the breakout above the February 27 high, today could be a strong bull trend day.
However, the 2 bears days were strong, and they followed a strong rally last week. As a result, there is enough confusion to make a neutral day likely today. This means at least one leg up and one leg down, and not a big trend day up or down.
Yesterday’s setups
Here are several reasonable stop entry setups from yesterday. I sometimes also show limit order entries and entries on the close of bars.
EURUSD at apex of triangle so quiet trading likely
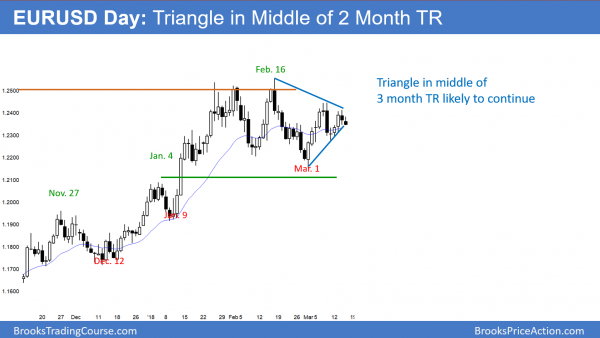
The EURUSD daily Forex chart is at the apex of a triangle and therefore in Breakout Mode.
The EURUSD daily Forex chart is at the apex of a triangle in the middle of a 3 month trading range. It is therefore as neutral as it can be. A triangle has a 50% chance of a successful breakout up or down. Furthermore, there is a 50% chance that the 1st breakout attempt will reverse.
Finally, since the triangle is in the middle of a 3 month trading range, a successful breakout of the triangle could simply lead to a test of the top or bottom of the range, and then another reversal within the range. All financial markets might be neutral going into next Wednesday’s FOMC announcement.
Until there is a strong breakout of the 3 month range, traders will correctly assume that the range will continue. They therefore will take profits on shorts and go long near the bottom and take profits on longs and go short near the top. They need to see a strong breakout with follow-through before they will bet on a trend.
Overnight EURUSD Forex trading
While the EURUSD 5 minute Forex chart has sold off for 2 days, it fell only 70 pips. In addition, the selloff is just two legs down from a 3 day rally. Day traders are scalping until there is a strong breakout up or down. Since the daily chart is at the apex of a triangle, there will probably be a breakout within the next week.
Summary of today’s S&P Emini futures price action and what to expect tomorrow
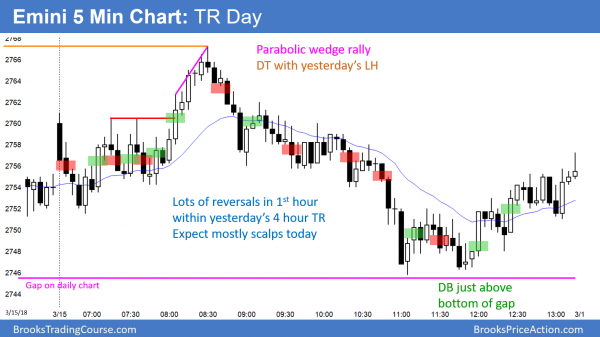
The Emini reversed down from a double top with yesterday’s lower high. It reversed up from a double bottom below yesterday’s low and just above the bottom of a gap on the daily chart. The result was a trading range day.
The Emini rallied, sold off, and closed in the middle third. It was therefore a bear doji bar and a trading range day. Since it had a bear body, it confirmed the big bear bars of the past 2 days. However, the odds still favor a neutral market ahead of next Wednesday’s FOMC announcement.
See the weekly update for a discussion of the price action on the weekly candlestick chart and for what to expect going into next week.
Traders can see the end of the day bar-by-bar price action report by signing up for free at BrooksPriceAction.com. I talk about the detailed S&P Emini futures price action real-time throughout the day in the BrooksPriceAction.com trading room. We offer a 2 day free trial.
When I mention time, it is USA Pacific Standard Time (the Emini day session opens at 6:30 am PST, and closes at 1:15 pm PST). You can read background information on the intraday market reports on the Intraday Market Update page.


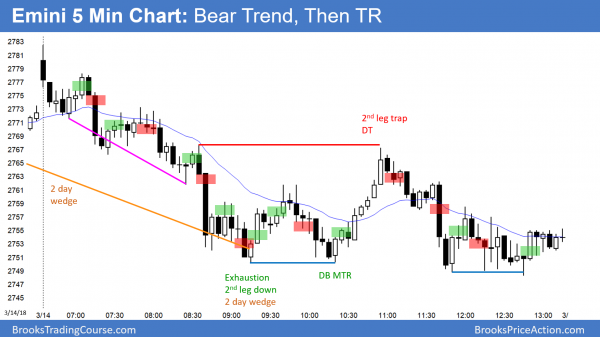
There is a double top on the emini between 715 and 740, then you draw a line over to indicate an entry on the big bull bar at 810. why is this a buy? it seems this could be resistance and a sell. is it a buy right at the double top line or one tick above?
I think at that point it was betting that the DT would fail, and entering on a stop exactly where those double top traders exited with a loss (1 tick above). Some DT traders may have exited 3 bars earlier already (above the bull doji).
Jakub is right. The bears had a double top, and both bars of the double top were good sell signal bars. Furthermore, the double top was a lower high. This is a credible candidate for a swing down. Those bears had an obvious stop 1 tick above. If they got stopped out, the odds were that there would be a rally that would go about the height of the double top before bears would look to sell again. The bears were likely to give up. That big breakout bar shows that they gave up. The bulls expected this and they bought 1 tick about the double top.
I think SPY is going to confuse traders even more. I expect a test of 2726-2736 in coming days, which is the support of upward sloping trendline on the daily chart. However, the journey till 2726 will whipsaw bulls and bears!