Trading new all-time high stock market breakout: Updated around 7:04 a.m.
The Emini began with an opening reversal up from a test of the old all-time high. It was also a 2nd leg down from yesterday’s double top major trend reversal. Yet, the buy signal bar had a big tail on top. Furthermore, the Emini was still forming lower highs after yesterday’s double top.
The bears got an opening reversal down from a lower high at the moving average. Both limit order bulls and bears made money in the 1st few bars. This is a breakout mode open. The bulls still want a 2nd leg up after yesterday’s early rally, and the bears want a reversal down from yesterday’s double top.
The early trading range price action and the abundant trading range price action of the past two weeks reduce the chance of a trend day today. Most days have had at least one swing up or down, and today will probably be the same. While a strong trend can form at any time, the odds favor a lot of trading range price action again today.
Trading a breakout to a new all-time high: Pre-Open Market Analysis
The Emini daily chart had an ioi Breakout Mode pattern on Monday. The Emini broke to the downside on Tuesday and to the upside on Wednesday. The bulls still have the problem of too much risk. Their stop is still 100 points below. Many cannot risk that much. The easiest way to reduce risk is to take partial profits and reduce the position size. Although yesterday had a strong rally, many bulls will use rallies like that to take profits. The odds are that yesterday’s rally will still be part of the trading range that began with last week’s start of the ioi candlestick pattern.
The Emini is clearly in a strong bull trend. Hence, it is always easier to make money as a bull. Even though many firms will take profits on rallies this week, if there are more firms buying, the rally will continue. Trends usually go much further than what seems likely. Just because the logic and therefore probability favors profit taking does not mean that there will be much. This rally could go much further before there is more than a 3 day pullback, yet that is unlikely. The odds still favor a trading range for at least a few more days.
Emini Globex session
The Emini has been in a trading range overnight, after yesterday’s 5 hour trading range. The bulls want trend resumption up after yesterday’s early rally and the bears want a trend reversal down. The probability is the same for both.
Pullback within a week
As I have been saying, the odds of more than a few more days up are less than the odds of a few days down. The stops are simply too far for the bulls and they will probably use any rally to reduce their position size. This will probably result in a 30 – 40 point pullback over the next week.
The bears want the pullback to grow into a Final Flag Reversal on the daily chart. The bulls will buy it, seeing it as a test of the breakout above the 2 year trading range. The 6 week rally has been strong enough to make the bull case more likely. Yet, the probability is only about 55% because the monthly chart is so late in a bull trend.
Forex: Best trading strategies
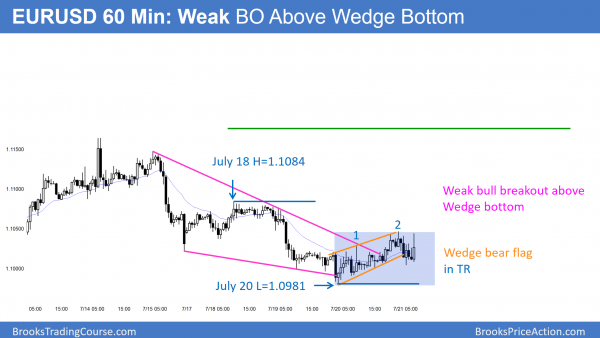
While the 60 minute EURUSD Forex chart broke above a wedge bottom, the rally has been weak. Because it has 3 pushes in a bull channel, it is a bear flag. There is a 50% chance of a breakout and measured move up or down.
The EURUSD daily chart is still in its month-long tight trading range. Yesterday was a test of the bottom of the range. The bulls got a small reversal up. However, the rally was a almost flat bull channel on the 60 minute chart. A bull channel is a bear flag. Once a bear flag gets 20 bars like this, the probability of a bull breakout is the same as it is for a bear breakout. The bulls need to get above lower highs to convert the bear trend into either a trading range or a bull trend. Yet, there is no evidence of which direction will prevail.
The 1st target for the bulls is the top of the channel, high is the July 18 lower high of 1.1084. If the EURUSD gets there, it typically would find sellers and the chart would enter a small trading range. That range would be nested within the 1 month trading range. That range is nested within the yearlong trading range. As long as the EURUSD Forex chart is within these ranges, most day traders will mostly scalp.
European Forex session
The EURUSD 5 minute chart has been in a 40 pip range overnight, which means that day traders were scalping. Many used limit orders and wide stops, and they scaled in. While the 60 minute chart has been in a bull channel for about 30 hours, the rally is only about 50 pips. This is a bull leg in a trading range. Hence, the 5 and 60 minute charts are still in breakout mode.
Summary of today’s S&P Emini futures price action and what to expect tomorrow
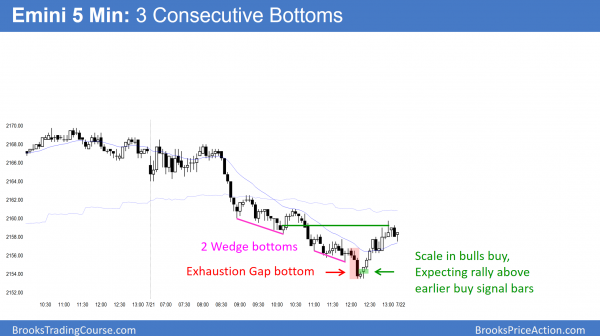
The Emini sold off in a Spike and Channel bear trend today. After consecutive wedge bottom attempts and then a sell climax bottom, the bulls finally got a reversal at the end of the day.
The Emini was in a strong bear trend today. Even though it reversed up at the end of the day, there is still a 50% chance of follow-through selling in the 1st 2 hours tomorrow. There is only a 25% chance of a strong bear trend day. There is a 75% chance of at least 2 hours of sideways to up trading that begins by the end of the 2nd hour. It might have already begun.
See the weekly update for a discussion of the price action on the weekly candlestick chart and for what to expect going into next week.
Traders can see the end of the day bar-by-bar price action report by signing up for free at BrooksPriceAction.com. I talk about the detailed S&P Emini futures price action real-time throughout the day in the BrooksPriceAction.com trading room. We offer a 2 day free trial.
When I mention time, it is USA Pacific Standard Time (the Emini day session opens at 6:30 am PST, and closes at 1:15 pm PST). You can read background information on the intraday market reports on the Intraday Market Update page.


Hi Al,
I’m new to your site and appreciate your approach to price action trading. But I have Tradestation question you use on your charts. Where in TS do I find the tool that you use to insert the measured move indicator you use on your charts?
Thanks.
Drawing/Fibonacci Tools/Price Retracement Lines
Hi Al
would you please clarify the concept of ” Always In ”
can a market be ” in a Bull trend ” but is ” Always In short ” ?
thank you
https://brookstradingcourse.com/how-to-trade-manual/always-long-always-short/