Emini stalling after 2500 September breakout
Updated 6:51 a.m.
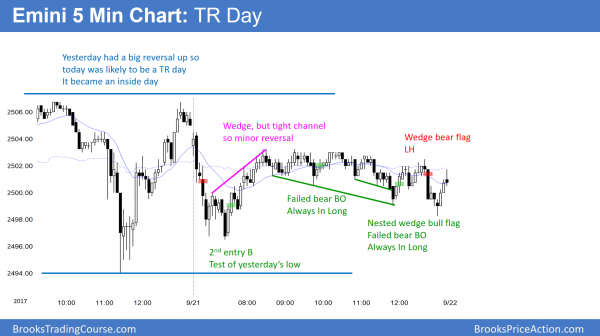
The Emini gapped below yesterday’s low and therefore triggered a sell signal on the daily chart. Yet, the 1st bar was a strong bull bar and it reversed up above yesterday’s low. However, the 2nd bar had a bear body, which was a reversal back down. Reversals usually lead to trading ranges, and this open reduces the chances of a strong trend day. This is especially true since the Emini is still in a 5 day tight trading range.
This is a limit order open. The location at the bottom of a 5 day trading range is good for the bulls. In addition, the open of the week and 2500 are magnets that are not far above. Yet, the Emini reversed on each of the 1st 5 bars. This increases the odds that today will be another mostly sideways day. If there is a strong breakout up or down, the day still might become a trend day, but the odds are against it at the moment.
Pre-Open market analysis
The past 4 days were doji days in a tight trading range. Since markets have inertia, today will probably be another trading range day. However, yesterday was an inside day after an outside day. It is therefore both a buy and sell signal bar. Since it has a bear body, it is more reliable as a sell signal bar. Furthermore, the Emini will probably pull back below the August high soon.
Because today is a Friday, weekly support and resistance are important. This is especially true in the final hour. The week so far is a small doji bar on the weekly chart. Therefore this week’s high, low, and open are all important. If the week remains small, it will be a sell signal bar on the weekly chart for next week.
Overnight Emini Globex trading
The Emini is down 5 points in the Globex market and therefore near yesterday’s low. While yesterday is a sell signal bar in an ioi setup on the daily chart, it had a big tail below. In addition, there have been 4 doji bars. Finally, the bull trend has been in a tight bull channel. Consequently, this is not a strong sell setup.
Even though the buy climax on the weekly and monthly charts are likely to end within a month or two, the daily chart probably has to go sideways for at least several more days before the bears can reverse the rally. This is because a strong bull trend usually has to transition into at least a small trading range before traders will believe that the bears are strong enough to take control. As a result, although yesterday is a sell setup, the odds are that the Emini will continue sideways at least a little longer. Therefore, today will probably be another day that is mostly a trading range day.
Yesterday’s setups
Here are several reasonable stop entry setups from yesterday. I sometimes also show limit order entries and entries on the close of bars.
EURUSD Forex market trading strategies
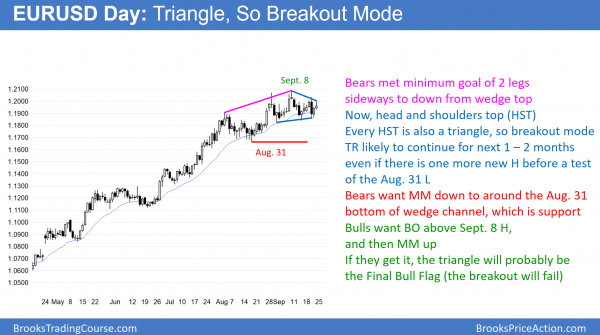
The EURUSD daily Forex chart is in a triangle and therefore in breakout mode.
The daily EURUSD Forex chart is in a triangle in a bull trend. It is also likely in a trading range that began with the August 17 low. The odds are that EURUSD market will test that low within a couple of months. However, it might have one more leg up first. A triangle late in a bull trend is usually the final bull flag. This means that if the bulls get a rally above, the rally will typically fail at around a measured move up. Th initial target of a reversal down is the apex of the triangle. However, since the rally from the August 17 low is the start of a channel, it is also a target.
A strong bull trend usually does not reverse into a bear trend. However, if could selloff several hundred pips in what would then become a trading range. This is what is likely over the next few months. The daily chart is simply deciding if the September high is the top of the incipient trading range or if there will be one more brief leg up.
Overnight EURUSD Forex trading
The 5 minute chart rallied and sold off in a 45 pip range overnight. Since the daily chart is at the apex of a triangle, a strong breakout of 200 pips or more can begin at any time. However, when a market is in a tight range, the odds are that the range will continue. Therefore, even though s breakout is likely soon, the odds are that every day will be a trading range. Once the breakout begins, day traders will switch from scalping to swing trading.
Summary of today’s S&P Emini futures price action and what to expect tomorrow
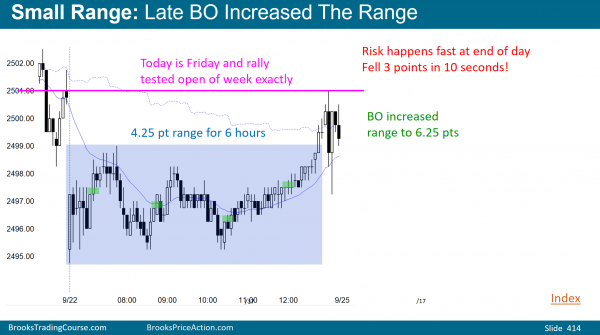
The Emini was in a small range for most of the day and therefore the odds favored a breakout. The bulls got a Buy The Close finish to close the week around the open. However, there was a sharp brief reversal down and the week closed below the open and below 2500.
By breaking below yesterday’s low, today triggered a sell signal on the daily chart. However, since today was not a big bear day, it was a week entry bar for the bears. The odds are that the Emini will continue in its 5 day tight range again on Monday.
The weekly chart formed a sell signal bar this week. However, it was only a bear doji. In addition, the channel is tight. Therefore any reversal down will probably lead to a trading range and not a bear trend.
See the weekly update for a discussion of the price action on the weekly candlestick chart and for what to expect going into next week.
Traders can see the end of the day bar-by-bar price action report by signing up for free at BrooksPriceAction.com. I talk about the detailed S&P Emini futures price action real-time throughout the day in the BrooksPriceAction.com trading room. We offer a 2 day free trial.
When I mention time, it is USA Pacific Standard Time (the Emini day session opens at 6:30 am PST, and closes at 1:15 pm PST). You can read background information on the intraday market reports on the Intraday Market Update page.


