Testing March 27 double top neckline for 5 percent correction
Updated 6:49 a.m.
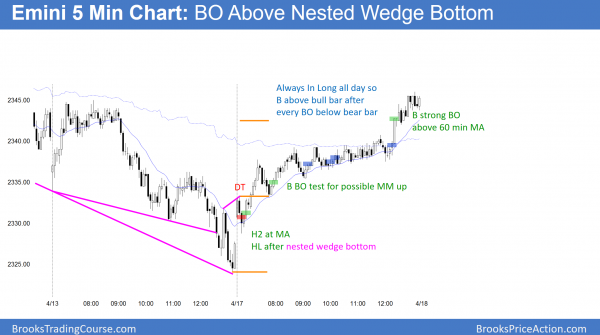
The Emini gapped up after a nested wedge bottom on the 60 minute chart. Yet, the 1st 2 bars were moving average gap bars in a bear trend. The bears therefore hope that the Emini is forming an early high of the day. But, the selloff from moving average gap bars usually leads to a major trend reversal setup. Hence, the odds are against a big bear trend. More likely, traders will buy around Thursday’s low.
Since the high of the 1st bar was about 9 points above Thursday’s low, it formed a Big Down, Big Up, Big Confusion pattern. Hence, the odds are that the Emini will have a trading range open for the 1st hour or two.
At the moment, the Emini is Always In Short. Yet, the Big Down, Big up pattern, and the tail below the 2nd bear bar make an early trading range likely. A big bear trend day is unlikely since there is a wedge bottom. A big bull trend day is less likely because of the 2 early bear bars. Yet, the context is good for the bulls, and if there is a strong trend day, up is more likely than down. This early confusion makes a lot of trading range trading likely today. The Emini is now trying to decide on the direction of the 1st 2 – 3 hour swing.
Pre-Open market analysis
The Emini has sold off for 2 weeks. Yet, it is still above the March 27 neck line of the double top on the daily chart. The bulls therefore hope for a rally to test the March 15 lower high. Yet, because of the unusually strong sell climaxes on the weekly chart, the odds are that any rally will result in a lower high. In addition, the Emini will probably break below the March 27 neck line of the double top within a month or two.
While the odds favor a rally this week because of a test of the bottom of the 2 month range, that rally will probably be a leg within the trading range instead of a resumption of the bull trend.
Overnight Emini Globex trading
The Emini is up 3 points in the Globex market. There is a wedge bottom on the 60 minute chart. In addition, the selloff is still within a 2 month trading range. Finally, April is seasonally bullish. As a result, the odds are that the Emini will rally this week. Yet, there is still room to the March 27 low. Therefore, the wedge selloff might fall a little more before there is a swing up.
The initial target for the rally is the 2351.50 lower high within the wedge. The next target is the 2363.25 top of the wedge channel.
Since there is a 25% chance that a wedge bottom will have a bear breakout, traders should be ready for a possible break below the March 27 bottom of the 2 month trading range this week. Yet, even if there is a break below that low this week, there would be a 50% chance that the breakout would fail. As a result, the Emini would then rally to test the top April 10 of the wedge.
EURUSD Forex market trading strategies
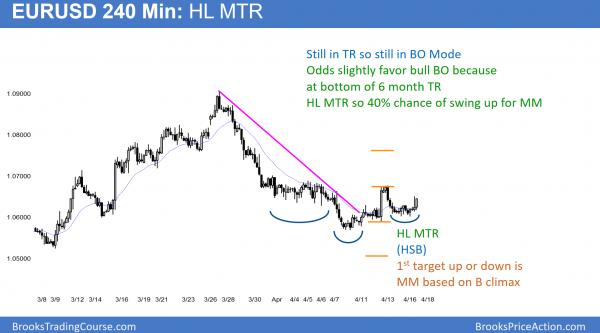
The EURUSD 240 minute Forex chart has a higher low major trend reversal. It is also a head and shoulders bottom.
Since it is still in a 3 week trading range, there is still a 50% of a breakout up or down. Like all swing trade setups, the initial probability for a swing up for a measured move is 40%.
The EURUSD had a 3 day sell climax in late March and then a 2nd leg down. It has been sideways for 3 weeks and it is in Breakout Mode. In general, there is therefore a 50% chance that there will be a successful breakout up or down. Yet, because this trading range is at the bottom of a 6 month trading range, the odds of the bull breakout are slightly higher.
The bears see the trading range as a double top bear flag. Consequently, they will sell rallies. In addition, they want a breakout below the range and then a measured move down.
As with all trading ranges, there is also a reasonable buy setup. The bulls have a higher low major trend reversal. Consequently, like with all major reversal setups, they have a 40% chance of a rally that will extend for a swing up to at least a measured move target. That target initially will be based on the height of last week’s buy climax bar. If it goes higher, the next target is based on the height of the 3 week trading range.
Overnight EURUSD Forex trading
The EURUSD Forex market rallied, sold off, and rallied again overnight. Yet, the legs were only about 30 pips. They were therefore still legs in the 3 week trading range. However, the odds still favor higher prices after the extreme selling in late March.
Since that selloff was still within the 6 month trading range, it was a sell vacuum test of the support at the bottom of the range. Because the bears failed to get a strong break below the range, the odds are that the selloff was just another leg in the range. Therefore, the odds favor a bounce that will probably retrace about half of the bear leg.
This could last at least a week. Furthermore, the rally will probably extend at least another 50 pips, and it could continue for 100 pips before there is a test back down.
Summary of today’s S&P Emini futures price action and what to expect tomorrow
After a nested wedge bottom, the Emini rallied form an opening reversal up from the moving average. It broke above the 60 minute moving average at the end of the day.
After selling off for 2 weeks, the Emini rallied from a nested wedge bottom. In addition, the reversal up was from just above the March 27 major higher low. Since the rally today was weak, the emini might get a 50% pullback this week. If so, the bulls will buy it because they expect a 2nd leg up from the wedge bottom. Therefore, a reversal up would be a higher low major trend reversal. In addition, it would be a head and shoulders bottom, where April 11 was the left shoulder.
While the odds favor higher prices over the next week or so, the daily chart is probably in an early bear trend. This is because of the extreme buy climaxes on the weekly chart. Consequently, bears will sell rallies, expecting a 5% correction over the next month or two.
See the weekly update for a discussion of the price action on the weekly candlestick chart and for what to expect going into next week.
Traders can see the end of the day bar-by-bar price action report by signing up for free at BrooksPriceAction.com. I talk about the detailed S&P Emini futures price action real-time throughout the day in the BrooksPriceAction.com trading room. We offer a 2 day free trial.
When I mention time, it is USA Pacific Standard Time (the Emini day session opens at 6:30 am PST, and closes at 1:15 pm PST). You can read background information on the intraday market reports on the Intraday Market Update page.


