Stock market bears creating selling pressure
Updated 6:49 a.m.
The Emini broke below the lows of the past several days on the open. The bulls want an Opening Reversal up from this support and an early low of the day. The selling is strong enough to make a strong bull trend day unlikely.
The bulls want another reversal day. There have been many in the past month. However, there is an unusual buy climax on the weekly chart. In addition, 8 of the past 10 days on the daily chart having bear bodies. Hence, the odds are beginning to shift in favor of a bear breakout of the month-long range.
The bears want any rally to fail. A reversal like this often gets back to the opening high and moving average over the 1st hour. If this does reverse up there, bears will look to sell a double top around the moving average. They will then look for a new low of the day and a measured move down. Less likely, the bear breakout could be a big bear trend day.
The odds are that today will either be a trading range day or a bear trend day. There is an increased chance of a big bear day.
Pre-Open market analysis
The Emini yesterday reversed up from below Monday’s low. Yet, there were 3 consecutive bear days and 5 bear days in the past 6 days. Furthermore, the weekly chart has the most extreme buy climax in the history of the Emini. Therefore, the upside is probably small. In addition, the Emini has probably begun a 3 month correction down to below the May 18 low and below the weekly moving average. Hence, the Emini is likely to pullback about 100 points.
Because the monthly chart is in in a tight bull channel, bulls will probably buy the 3 month pullback. However, since the monthly chart has a parabolic wedge top, there is a 40% chance of a deeper pullback.
Overnight Emini Globex trading
The Emini is down 8 points on the Globex chart. Since the Emini is in a month-long trading range, every rally will disappoint the bulls. In addition, every selloff will disappoint the bears. Because most days have been trading range days and small reversal days over the past month, the odds are that today will be another.
Yet, the buying on the weekly chart is extremely climactic. Hence, the odds are that there will be a swing down for the next couple of months. Furthermore, it might begin with one or two big bear trend days. There is therefore an increased chance of a couple big bear days within a couple of weeks.
Yesterday’s setups
Here are several reasonable stop entry setups from yesterday.
EURUSD Forex market trading strategies
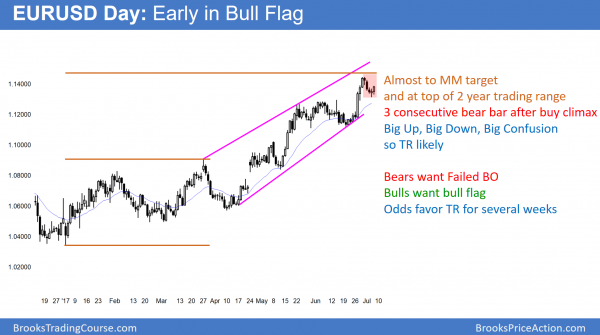
The pullback on the daily EURUSD Forex chart had 3 consecutive bear trend days. Since the bull trend is strong, the odds favor bull trend resumption. Yet, the bull flag might grow and contain several small legs up and down.
While the EURUSD daily chart has a bull flag, the pullback had 3 consecutive bear trend days. One was big and two closed near their lows. This is therefore a Big Down move after a Big Up move. Consequently, the chart is more balanced and therefore confused.
When there are 3 consecutive bear bars in a pullback and at least one is big and closes on its low, the bears are strong. Consequently, the 1st attempt to resume the bull trend usually fails. Therefore, there is typically at least one more attempt to reverse the market down.
Since this is a bull flag, the odds are that the bull trend will resume. Furthermore, it can resume at any time. Because the pullback was strong, it is likely to become more complex. Therefore, it will probably grow into a trading range over the next couple of weeks.
Overnight EURUSD Forex trading
The EURUSD Forex market has rallied 60 pips over the past 6 hours. The bulls hope that this is a breakout above the 4 day bear channel (bull flag). Yet, because the selloff in the bull flag was strong, the odds are that this 1st attempt to resume the bull trend will fail.
The bulls will be satisfied with the profit they made from buying yesterday and they will take partial or full profits. The bears will be confident of a 2nd leg down after their 4 day selloff and will begin to sell again. Hence this rally will probably begin to go sideways for a few hours and then turn down again.
Consequently, there is probably not much left to the rally today and the EURUSD market will probably go sideways today. Then, it will probably test down 50 or more pips again within a few days. The 150 pip early trading range will probably last at least a couple of weeks. During that time, traders will mostly scalp for 10 – 50 pips.
Summary of today’s S&P Emini futures price action and what to expect tomorrow
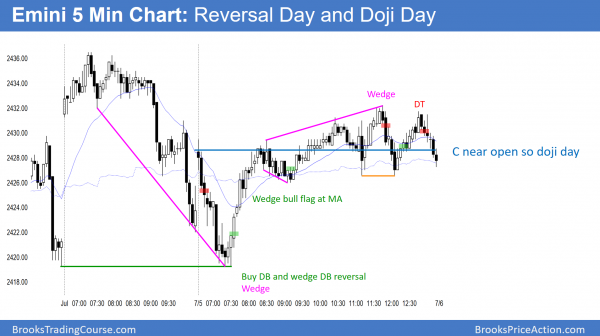
After a gap down, the Emini had a weak rally that tested the high of the open. It then sold off from the double top. The bear trend resumed.
See the weekly update for a discussion of the price action on the weekly candlestick chart and for what to expect going into next week.
Traders can see the end of the day bar-by-bar price action report by signing up for free at BrooksPriceAction.com. I talk about the detailed S&P Emini futures price action real-time throughout the day in the BrooksPriceAction.com trading room. We offer a 2 day free trial.
When I mention time, it is USA Pacific Standard Time (the Emini day session opens at 6:30 am PST, and closes at 1:15 pm PST). You can read background information on the intraday market reports on the Intraday Market Update page.


Hi Al,
I’m curious on the entry for bar 2. Can you elaborate a little. Thanks
Daniel
The market always looks for an early trend. The bulls tried to reverse up above bar 1, but were trapped by a big outside down bar closing below the low of 1. The odds were that the Emini would fall at least a little further.
I am not sure I understand the ‘signal bar’ in the ‘weak triangle’- prior to the breakout bar- the entry marked at 11:00 East Coast-or 8:00 a.m. Pacific. Can you explain that further ? The context (to the left) is clear-I thought that the double bottom at prices 12.00/12.25 was also significant- and the strong reversal off of those bottoms at 7:35/10:35-also the reversal on the two bars at 7:05/7:10 (10:05/10:10)By the way, I am very glad that I purchased the video course, and I think that these blogs serve as an excellent tutorial in tandem with the video course. thanks so much!
Ronnie
I agree that the Emini looked like it was trying to reverse up. In the chat room, I repeatedly said that the bad follow-through after the big bear bars made the early selloff more likely to be a bear leg in a trading range than the start of a bear trend. This is especially true with the Emini in a trading range for a month. The odds are that most moves up and down will fail.
Traders were looking to buy, and buying either above that 7:35 am bull bar for the double bottom, or above that 8 am doji bar for the triangle were reasonable. Neither had very high probability, but the risk was not big relative to the reward. Traders wanting higher probability waited for the big bull breakout at 8:05.
Hi Al,
I find the daily future’s summary very helpful to compare to trades I’ve taken or considered. What are the criteria for the trades marked? if one could just wait for those setups it seems very accurate.
Thanks,
Ron
I am trying to post reasonable setups that beginners can take if they patiently wait. It is hard to see many of them real time, but it is a good goal to get good at spotting them. These charts give traders practice.
I also find the 5-10 best trades on the end of day chart very useful Al, thanks!