S&P500 stock market wedge rally buy climax
Updated 6:56 a.m.
The Emini sold of on the 1st bar to test yesterday’s low. Yet, this was followed by a pair of dojis and a 4 bar tight trading range. Limit order bulls and bears made money in the 1st few bars. Hence, these are signs that today probably again will have a lot of trading range price action, like most of the days of the past 2 months.
Swing traders need a strong breakout with follow-through up or down. Without that, day traders will expect every rally and selloff to be legs within a trading range. Therefore, after 2 – 3 hours, they will look for an opposite swing. A trend can begin at any time. Yet, the odds are that today will be a trading range day. Therefore, a trend up or down will probably reverse in the middle of the day.
Pre-Open Market Analysis
The bears last week had a chance to get a strong outside down bar on the weekly chart, but failed. The bulls failed to close above the open of last week. The result was that last week was the 1st bear bar on the weekly chart in 8 weeks.
Possible wedge top on the daily chart this week
Because 7 consecutive bull bars is climactic, there is only a 40% chance of a strong rally before a pullback. Yet, there are still targets above at 2220 and around 2200. Additionally, I talked about higher targets in my weekend update. Furthermore, the momentum up on the weekly chart is strong. The odds still favor one more push up on the daily chart.
However, if the Emini then reverses down from that 3rd push, there would be a wedge top on the daily chart. Traders would therefore expect at least a couple of legs down. If there is a reversal down, it would probably be 2 – 5%. Hence, 40 – 100 points. A 100 point correction would dip back below the breakout point at the top of the 2 year trading. It would also close the gap on the daily, weekly, and monthly charts. Since this breakout is late in a bull trend, the gap will probably close.
Because the momentum up on the monthly and weekly charts is strong, bulls will buy the pullback, even if it falls back into the 2 year trading range. The bears probably would need a breakout below the 1800 bottom of the range before traders will conclude that the Emini converted to a bear trend.
Emini Globex Session
The Emini is down 3 points in the Globex session and in the middle of its 3 week trading range. It is still in breakout mode in a bull trend. As boring as the past 2 months have been, they have also been fascinating. The Emini is making a major decision. Will it close the gap above the 2 year trading range? The odds are that it will, which means that it fall back below 2100.
Yet, there are targets above and the momentum is strongly bullish on the weekly chart. Therefore, the Emini might have one more rally. In fact, when the Emini is close to major resistance, it often gets sucked up quickly in a buy vacuum. This often creates a buy climax top. While the tight trading range has been boring, it will probably soon lead to huge trend days. The Emini has not yet decided if there will be a few up before the ones down begin.
It is close enough to the resistance so that traders are wondering if the test is complete. If enough decide that it is, the reversal down could begin any day. The bears need a big bear trend day, which would be a sign that they have taken control. Until then, the odds still favor the bulls.
Forex: Best trading strategies
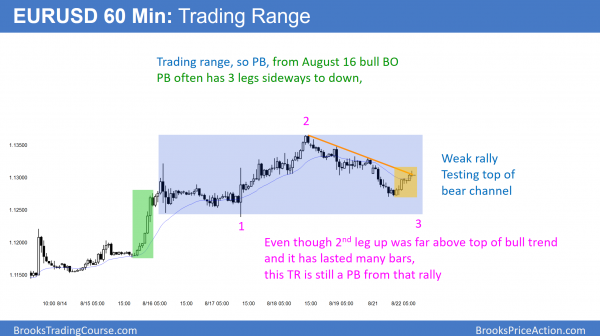
The EURUSD 60 minute chart reversed up overnight and is testing the bear trend line. Yet, the rally is probably only a bull leg in a trading range. The entire trading range is a sideways pullback from the August 16 bull breakout. Sometimes a pullback has many more bars than the breakout. Because it is now in a trading range that has lasted far more than 20 bars, it is in Breakout Mode.
The daily chart of the EURUSD Forex market has a strong bull swing. Yet, every bull bar led to a bear or doji bar. The rally lacks consecutive big bull trend bars closing on their highs. This lack of urgent buying happens more often in a trading range. Therefore, this rally is probably a bull leg in a trading range.
The bull channel from the August 5 low is tight enough so that bulls will probably buy the 1st reversal down. Furthermore, the June 24 top of the sell climax is a magnet that is pulling the market up. This means that the best the bears will probably get over the next few days is a pullback. Hence, they will probably need at least a micro double top before they can take control again.
EURUSD overnight Forex session
While the 60 minute chart reversed up overnight, the rally lacked consecutive big bull trend bars, it covered only 40 pips, and it is stalling at a bear trend line. It is probably just a bull leg in the 2 day trading range. Until there is a strong breakout up or down, most traders will take quick profits. Although there is room to the bottom of the trading range, the selloff went close enough to the bottom to make traders wonder if the test was good enough. If so, the bull trend wiil resume.
Yet, the odds are that the trading range will continue. This is because 2 of the past 4 bars on the daily chart were dojis. The other two formed a 2 bar reversal, which is a 2 day doji. This is trading range price action. While the bulls hope that today will be a buy signal bar, the odds are that there will be sellers above tomorrow. The result will probably be at least a couple more days of trading range price action. Furthermore, the entire rally from the June low is just a bull leg in a yearlong trading range. Few traders are willing to hold positions for more than a 3 – 10 days at a time.
Summary of today’s S&P Emini futures price action and what to expect tomorrow
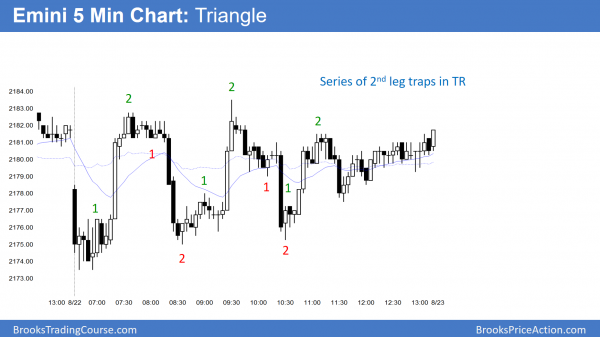
The Emini had many big reversals in a trading range day. All were 2nd Leg Traps.
The bulls continue to fail at the bottom of last week’s island top. Yet, they keep buying the brief sharp selloffs. This increases the chances that the Emini will break to a new high this week. If it gaps up tomorrow, it will form a 5 day island bottom. This would therefore erase last week’s island top. While the bears currently are in a reasonable short since last week’s top, the probability favors the bulls near-term.
See the weekly update for a discussion of the price action on the weekly candlestick chart and for what to expect going into next week.
Traders can see the end of the day bar-by-bar price action report by signing up for free at BrooksPriceAction.com. I talk about the detailed S&P Emini futures price action real-time throughout the day in the BrooksPriceAction.com trading room. We offer a 2 day free trial.
When I mention time, it is USA Pacific Standard Time (the Emini day session opens at 6:30 am PST, and closes at 1:15 pm PST). You can read background information on the intraday market reports on the Intraday Market Update page.


Hi Al,
On 5mins chart, there is a rising wedge and it is close to its narrowed top. In this situation what type of signal bar do we look for as there are a lot of overlapping bars but it yet manage to post higher low.
As it gives continous feeling of reversal so do you trade this type of trend like a variant of small pullback trend?
Many Thanks
Al when you release the new course can you include the slides separately in a pdf format? This would be very helpful. Thank you