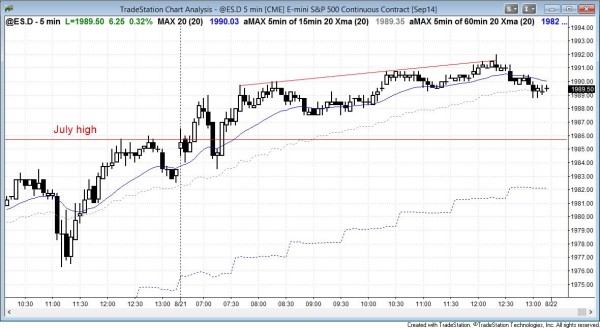
I posted this chart after the close.The S&P500 Emini’s dominant price action feature of the today for day traders was the opening reversal up from the double bottom at the July high.
End of day comments about today’s Emini day trading
The S&P500 Emini reversed down sharply at the open, but it turned out to be a bear trap. It then reversed up strongly at the July high and then resumed yesterday’s broad bull channel for the rest of the day. However, it spent most of the time in a tight trading range, offering few opportunities for day trading.
S&P500 Emini intraday market update for day traders
Time of update 8:14 a.m. PST.
The S&P500 Emini rallied from a double bottom at the July high and started the day in a broad bull trend channel. However, it was overbought and near measured move targets, and this made day traders cautious because of the increased the chances of a trend reversal down at some point, at least into a trading range.
Channels usually evolve into trading ranges, and that is likely today. This is especially true because Yellen’s talk tomorrow tomorrow might result in a sharp move up or down. The stock market usually tries to get neutral before a potential market moving event. This increases the chances of today becoming mostly sideways.
Although it is possible that the bull trend channel could continue up all day, it is more likely that the day will become increasingly two-sided, with bears selling near the highs and bulls buying pullbacks. The bears want a major trend reversal, which they might get, given how overbought the stock market is. The bulls want the broad bull channel to continue all day, but this is not likely since the S&P500 is so overbought and there is a news event tomorrow. At the moment, the Emini is in a bull trend and the odds favor at least a little more up.
S&P500 Emini daily and weekly candle charts
The S&P500 Emini broke above the July high to a new all-time high yesterday, and this turned the candle on the monthly chart into an outside up bar for August. This is a sign of strength. However, when the stock market has unusual strength late in a trend, especially when the market is overbought, a strong move up like this is more likely to be an exhaustive buy climax than the start of a new leg up. The monthly chart has been this far from the moving average and this many bars away from the moving average only three in the past 20 years (1998, 2003, 2009). Each time was followed by a reversal that was at least 20%. No one knows if this size reversal will happen this time.
This means that the risk of a pullback to the moving average is high. The S&P500 can get there by going sideways or down, and it could happen quickly in just a few bars (months) or it might take many bars (a couple of years). In any case, when the stock market is this overbought, the upside is usually limited.
There is famous quote attributed to John Maynard Keynes when he talked about traders shorting overbought markets: “The market can remain irrational longer than you can remain solvent.” Traders who are long should protect themselves by buying puts. Bears will begin to scalp on very strong bull trend days, betting that the strong bull trend will begin to evolve into a trading range. Bulls will begin to scalp more, as well, because they will become concerned that there is not much left to the trend. After a trading range forms, the bears will try to trigger a major trend reversal and a measured move down. The bulls will try for trend resumption up, with a bull breakout and a measured move above the trading range. No matter what the outcome of the trading range on the monthly chart, the odds are high that the S&P500 will touch the moving average before it goes much higher.
See the weekly update for a discussion of the weekly chart.
Traders can see the end of the day bar-by-bar price action report by signing up for free at BrooksPriceAction.com. I talk about the detailed Emini price action real-time throughout the day in the BrooksPriceAction.com trading room, and a 2 day free trial is available.
When I mention time, it is USA Pacific Standard Time (the Emini day session opens at 6:30 am PST, and closes at 1:15 pm PST). You can read background information on the intraday market reports on the Intraday Market Update page.

