Posted 7:05 a.m.
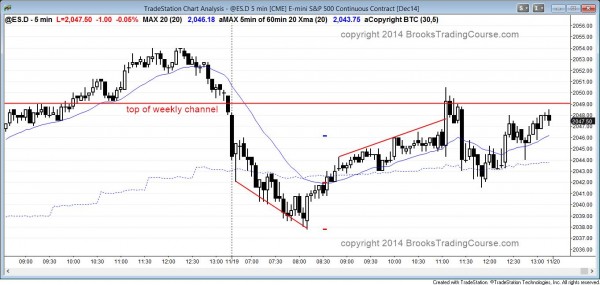
Today opened with a sell vacuum test of support, which is at the bottom of yesterday’s channel and at the 60 minute moving average. It then briefly became a limit order market. This increases the chances that today will be a trading range day. Because of the sell climax on the open, the downside might be limited for at least a couple of hours and the Emini might begin to channel up. However, the selling was strong enough from yesterday’s high to make a bull trend day unlikely.
The Emini is always in short. The bulls need a strong bottom and upside reversal before day traders will be willing to swing trade on the long side. More likely, any rally will be a bull leg in a trading range day. The bulls might be able to test the top of the weekly channel again, which is around 2049. Even though the Emini is always in short, it will probably form an early low and then enter a bull channel. The day will probably be a trading range day, although it is currently a bear trend.
The bears want a big bear trend day, but they are struggling to push the Emini far below the 60 minute moving average. This means that many bears are taking quick profits, which is a sign that they are not confident that the trend down will go far.
Yesterday ended with a reversal down after a spike and channel bull trend. The channel is usually the start of a trading range. Today’s open quickly fell to the bottom of the channel, and to the bottom of a bigger bull channel, and to the 60 minute moving average. This might be a sell vacuum down to support and it can result in an opening reversal bottom and an early low of the day. The selloff from yesterday’s high is so big and strong that today is unlikely to be a bull trend day. However, if it forms an early low, it could channel up for most of the day. This would then create a big trading range that would have begun with yesterday’s channel. The bears want today to be a bear trend day after the Emini broke above the top of the weekly and 60 minute bull channels and then reversed down.
Day trading outlook for tomorrow’s Emini price action

The Emini had a wedge bottom and an opening trend reversal up from yesterday’s low and the 60 minute moving average. The rally again failed at the top of the weekly bull trend channel.
Today ended with another leg in a 2 day trading range. The Emini might be forming a triangle around the top of the weekly channel, around 2049. If so, it could be a top in an overbought 60 minute, daily, and weekly bull trend, or it could lead to a bull breakout. If it does have a bull breakout, this might be the final flag before a bigger correction, like at least 10 bars and 2 legs down on the 60 minute chart. A triangles late in a trend often becomes the final flag before there is a major trend reversal.
Yesterday ended with a bear trend reversal after failing to hold the breakout above the top of the weekly channel. The Emini might take several bars to decide whether the bulls will be successful. This means several weeks because this is the weekly chart. It might have to have 2 failed breakout attempts before it reverses down to test the bottom of the channel. There is a 75% chance that these bull breakout attempts will fail and that the Emini will go sideways to down to the bottom of the channel over the next 10 bars (weeks) or so. There is about a 25% chance that the bull breakout will be successful and that the trend will become an even stronger bull trend, like it did on the monthly chart in 1994.
Premarket price action analysis
See yesterday’s intraday market update report for today’s premarket analysis. Once there, scroll down to the heading, Day trading outlook for tomorrow’s Emini price action.
See the weekly update for a discussion of the weekly chart and for what to expect going into next week.
Traders can see the end of the day bar-by-bar price action report by signing up for free at BrooksPriceAction.com. I talk about the detailed Emini price action real-time throughout the day in the BrooksPriceAction.com trading room, and a 2 day free trial is available.
When I mention time, it is USA Pacific Standard Time (the Emini day session opens at 6:30 am PST, and closes at 1:15 pm PST). You can read background information on the intraday market reports on the Intraday Market Update page.

