S&P500 double top at all time high causing 5 percent correction
Updated 6:53 a.m.
The Emini reversed up from above yesterday’s low without a strong buy signal bar. Since yesterday is a sell signal bar and the context is good, the odds are today will trade below its low. Furthermore, the 60 minute moving average is also a magnet and it is just below yesterday’s low.
While the Emini is trying to reverse up from above yesterday’s low, the odds are that the reversal will fail. Yet, if the bulls can create a series of bull bars or a tight bull channel, like yesterday, they will take control.
The Emini had 3 consecutive bull bars and is therefore Always In Long. Yet, the odds are that the rally will fail. Furthermore, the Emini will likely trade below yesterday’s low in the 1st 2 hours today. This would require another leg down. Therefore, today will probably begin with a trading range open and be in breakout mode.
Because of the potential for political news, a breakout up or down can come at any time. But, since uncertainty is a hallmark of a trading range, the odds favor a lot of trading range trading.
Pre-Open market analysis
Yesterday got to within about 3 points of the all-time high, yet pulled back repeatedly. While the momentum up this week is good for the bulls, the extreme sell climax on the weekly chart limits the upside. Consequently, if the bulls get a new all-time high, the odds are the rally will fail within a few weeks.
The bears are trying to create a major trend reversal down on the daily chart. Because of the unusual buy climax on the weekly chart, a sell signal on the daily chart will have more than the usual 40% chance of a swing down. The probability of a swing down over the next month or two to at least the weekly moving average is 70%. Since major trend reversals often need a 2nd or 3rd signal before the reversal begins, the probability that the 1st reversal down will succeed is only 50%.
Since the momentum up this week is strong, the bears will probably need at least a micro double top. But, since the weekly buy climax is so extreme, there is a higher probability that the Emini will reverse down strongly at anytime, even without a micro double top.
Since yesterday was a sell signal bar, the odds are that today will trade below yesterday’s low. Since the bears will probably need at least a micro double top, the odds are that there will be buyers below. Hence, a bull flag is more likely than a trend reversal.
Overnight Emini Globex trading
The Emini is up 3 points in the Globex market. Since it is not far above yesterday’s low and yesterday was a sell signal bar on the daily chart, the odds are that today will trigger the sell and trade below yesterday’s low. Yet, the bulls have a 9 day bull micro channel on the daily chart. Therefore, the bulls are strong. Hence, they will probably buy the 1st reversal down.
Since the Emini has been in a range for 2 months, most days have been trading range days. That is likely again today, even though a drop below yesterday’s low would trigger a sell signal on the daily chart.
EURUSD Forex market trading strategies
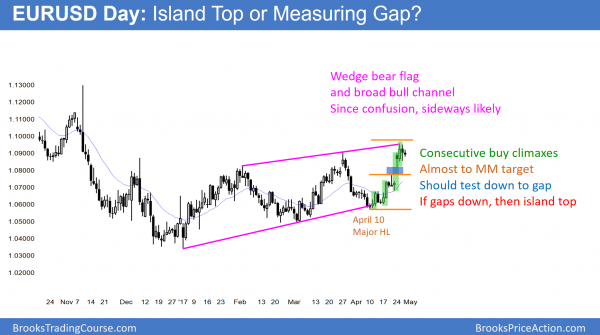
The EURUSD daily Forex chart has a weak breakout above a 6 month trading range. The bears see a wedge bear flag. Yet, the bulls expect a measured move up. The 1st target is based on the gap, and the next is based on the height of the range.
The EURUSD daily Forex chart is stalling after a small breakout above the top of a 6 month trading range. The bulls want a measured move up based on the 500 pip height of the range. If they are successful, they would then want a breakout above the 2 year range. Furthermore, they would hope for a 1,000 pip measured move up based on that range.
Since most breakouts fail, the odds are that the 2 year trading range will continue indefinitely. The odds are that the eventual breakout will be to the downside because the monthly chart is below its moving average. The 1st target below the range is a test of par.
Most trading range breakouts fail
This week’s big gap up is a sign of strength for the bulls. Yet, since most trading range breakouts fail, and this one has stalled, the odds are against a big rally from here. If the bulls begin to create a series of big bull trend bars, traders would then believe that the breakout will succeed. In addition, they would think that the rally would continue up to the November high around 1.1300.
Since legs in trading ranges constantly disappoint bulls and bears, the odds are that this one will reverse down within a week or two. An obvious target is the gap, which is also around a 50% pullback.
Because the breakout has not been strong and the chart is in a nested trading range, traders are confused. Since confusion is a hallmark of a trading range, the odds are that the trading range will continue, even if this rally goes a little higher. When traders are confused, they buy low, sell high, and take quick profits, the result is a series of reversals and more bars added to the range.
Island top?
The EURUSD Forex market has been sideways for 4 days. It is deciding whether to continue up from its breakout above the 6 month range or reverse down. Since the 3 week rally has had a series of buy climaxes on the daily chart, the odds favor a pullback. Yet, since eventually every trading range breaks into a trend, the bulls are hoping that either there is no pullback and the rally resumes, or the pullback is brief and it quickly leads to a resumption of the breakout.
The bears want the rally to fail and for the 6 month range to continue. If the EURUSD chart gaps down within a week or two, this would create an island top. The bears would see that as a sign of strength. Yet, the odds are that a bear swing would not get far either. This is because trading ranges constantly reverse and constantly look like they are on the verge of successfully breakout out into a trend.
Overnight EURUSD Forex trading
The EURUSD Forex market has had repeated reversals for 4 days within a 100 pip range. The odds favor a 2nd leg sideways to down on the 240 minute chart. This is because a series of buy climaxes usually leads to a 2 legged correction. Monday’s gap is an obvious magnet if there is a correction.
Alternatively, the correction can be 2 sideways legs, which is what the bulls prefer. In either case, the 240 minute chart does not yet clearly have a 2 legged correction. Hence, the odds favor at least another day or two of sideways trading.
Summary of today’s S&P Emini futures price action and what to expect tomorrow
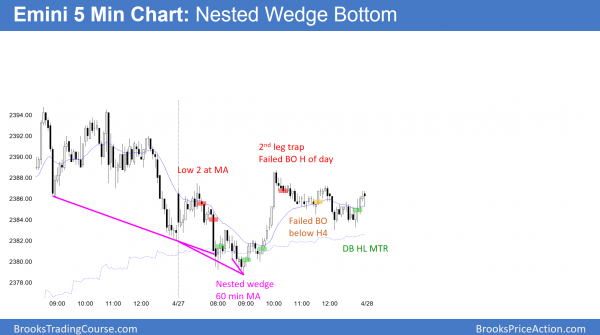
The Emini reversed up from a 2 day nested wedge bottom. The odds favor a 2nd leg sideways to up tomorrow.
The Emini is testing the all-time high. While the daily chart is bullish, the weekly chart has an extreme sell climax. Furthermore, the market tends to pull back in May and June. Finally, the Emini has not tested last year’s close. While there might be a breakout to a new high within a couple of weeks, the odds favor a 5% correction over the next month or two. This is a good time to buy June or July puts or put spreads.
See the weekly update for a discussion of the price action on the weekly candlestick chart and for what to expect going into next week.
Traders can see the end of the day bar-by-bar price action report by signing up for free at BrooksPriceAction.com. I talk about the detailed S&P Emini futures price action real-time throughout the day in the BrooksPriceAction.com trading room. We offer a 2 day free trial.
When I mention time, it is USA Pacific Standard Time (the Emini day session opens at 6:30 am PST, and closes at 1:15 pm PST). You can read background information on the intraday market reports on the Intraday Market Update page.


