Emini and Forex Trading Update:
Thursday March 12, 2020
I will update again at the end of the day.
Pre-Open market analysis
The Emini is locked limit down (5% down) in the Globex market. It will probably gap down in the day session.
This is the 3rd leg down on the daily chart. There is now a parabolic wedge selloff. That typically attracts profit takers.
Traders should expect a strong short covering rally to begin within a week or so. It could last 1 – 2 weeks. But it will still be a bear rally. The daily chart will probably be sideways or down for at least a couple months.
The cash index fell 1 point below the 20% pullback level and reversed up yesterday. It will probably close below that price within a few weeks and maybe today. There would then officially be a bear market and the end of the 12 year bull trend. However, there might be a 1 – 2 week strong short covering rally before the cash index finally closes 20% down. More likely, the rally will come after.
Open of the week has been a magnet
The Emini has spent 3 days oscillating around the open of the week. It might be a magnet for the rest of the week. This is true even though the Emini is now far below.
If the short covering rally begins today, it could get back to the open by tomorrow’s close. The candlestick on the weekly chart would then be a doji. That would be more neutral and much less bearish than how it looks right now.
Overnight Emini Globex trading
After the president’s speech last night, the Emini sold off. It has been bouncing off the -5% Globex limit down level for several hours. That increases the chance of a gap below the Globex limit down level on the open.
The 1st limit down level for the day session is -7%, which is just 2% lower. But this selling on the daily chart has become extreme. It increases the chance of surprisingly strong short covering soon. There is therefore an increased chance of a strong bull trend reversal today.
The daily chart is obviously in a strong bear trend. While that typically increases the chance of a big trend day, that is less likely here. The daily chart is extremely oversold and it has 3 legs down. Traders know that the bears have huge profits and they are looking for any reason to buy back their shorts.
Also, many bulls are looking to buy the start of a short covering rally. With many traders wanting to buy this sell climax, there is a reduced chance of a big bear trend today, despite the Emini being locked limit down in the Globex session.
Yesterday’s setups

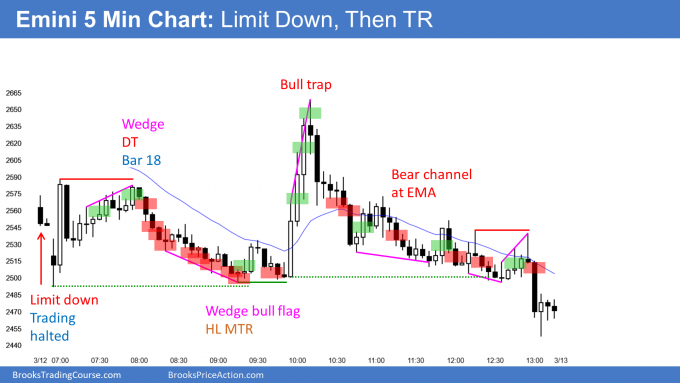
Here are several reasonable stop entry setups from yesterday. I show each buy entry with a green rectangle and each sell entry with a red rectangle. I rarely also show limit order entries and entries on the close of bars. Buyers of the Brooks Trading Course and Encyclopedia of Chart Patterns have access to a much more detailed explanation of the swing trades for each day.
My goal with these charts is to present an Always In perspective. If a trader was trying to be Always In or nearly Always In a position all day, and he was not currently in the market, these entries would be logical times for him to enter.
If the risk is too big for your account, you should wait for trades with less risk or trade an alternative market like the Micro Emini.
EURUSD Forex market trading strategies

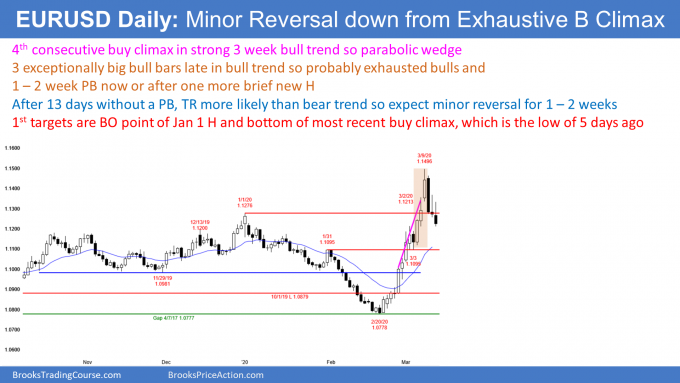
The daily chart of the EURUSD Forex market has reversed down from a parabolic wedge buy climax. The profit taking will probably last a couple weeks.
This week so far is a big bear reversal bar on the weekly chart. The bears want the week to close near its low. This week would then be a sell signal bar for a failed breakout above the bear trend line and the high of the past 13 months.
Traders will look for the typical downside targets after a parabolic wedge rally on the daily chart. These are the bottom of the final leg up, the breakout point (the January 21 high), and the 20 day EMA. Traders should expect the EURUSD to work lower.
If today is a 3rd consecutive bear day, it will increase the chance of the pullback reaching the targets. This is especially true if today closes near its low. Furthermore, it would tend to make the pullback last longer and fall deeper than it otherwise might. Consequently, the bulls will try to prevent today from closing near its low.
Overnight EURUSD Forex trading
The 5 minute chart of the EURUSD Forex market sold off again overnight. The candlestick on the weekly chart closes tomorrow. The bears want the week to close on its low. That would make traders wonder if the 3 week rally was just a leg in a incipient trading range and not the start of a bull trend. Consequently, the bears will sell rallies today and tomorrow.
Since the bulls always want the opposite, they will look to buy reversals up from around the session low. They hope that the selloff will form a bull flag on the daily chart. They want the rally to be a resumption of the 2017 bull trend.
But with bulls buying low and bears selling high, traders expect trading range price action today. The EURUSD has been sideways in a tight range for the past 3 hours after the selloff early in the European session.
The fight for the remainder of the day will be over the close. If today and this week close near the low, traders will expect a quicker move down to the targets. Additionally, the selloff would have a better chance of falling considerably below the targets before the bulls return.
Summary of today’s S&P Emini futures price action and what to expect tomorrow

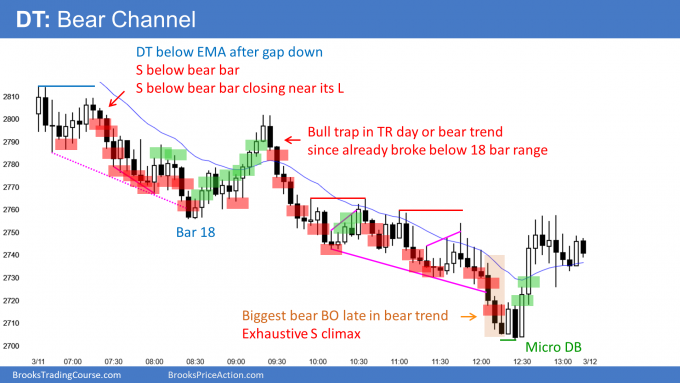
Here are several reasonable stop entry setups for today. I show each buy entry with a green rectangle and each sell entry with a red rectangle. I rarely also show limit order entries and entries on the close of bars. Buyers of the Brooks Trading Course and Encyclopedia of Chart Patterns have access to a much more detailed explanation of the swing trades for each day.
My goal with these charts is to present an Always In perspective. If a trader was trying to be Always In or nearly Always In a position all day, and he was not currently in the market, these entries would be logical times for him to enter.
If the risk is too big for your account, you should wait for trades with less risk or trade an alternative market like the Micro Emini.
End of day summary
The Emini was limit down in the Globex session. It quickly fell 2% more on the 1st bar and became limit down on the day session.
Today was a trading range day. There were 2 strong rallies but both failed. The day closed near its low.
Traders suspect that this selloff will test the December 2018 low. This year would then have erased all of 2019. Furthermore, this year would become an outside down bar on the yearly chart (where each bar is 1 year).
It is important to note that the S&P500 cash index closed more than 20% below its all-time high. It is therefore in a bear market, like the Dow and the Nasdaq. The bear market is probably secular and not cyclical. That means it could last for a decade.
See the weekly update for a discussion of the price action on the weekly chart and for what to expect going into next week.
Trading Room
Traders can see the end of the day bar-by-bar price action report by signing up for free at BrooksPriceAction.com. I talk about the detailed S&P Emini futures price action real-time throughout the day in the BrooksPriceAction.com trading room. We offer a 2 day free trial.
Charts use Pacific Standard Time
When I mention time, it is USA Pacific Standard Time (the Emini day session opens at 6:30 am PST, and closes at 1:15 pm PST). You can read background information on the intraday market reports on the Market Update page.


It seems to me the market is not even close to a floor. It may well be the top of the 2014-16 trading range at 2100 or even 1800. There is yet little sign of a bear rally although of course one can start at any time. But as you wrote some days ago, we’re going down.
I agree with your targets, but it might take a couple years to work down there. The 2 year trading range could continue for a year or more before there is a bear breakout.
thanks Al for the stops webinar, all the excellent analysis and commenting on bitcoin!
Al, If exchanges are shut down, do you think that FX trading might still be open ?
FX has nothing to do with exchanges. It is conducted entirely by banks. If a bank is open, it will trade FX. But if not many banks are open, the spreads will be big.
I doubt the exchanges will close because most trading is electronic. This is unlike in the 80’s and 90’s when floor traders dominated.
Also, what kind of message would the exchanges be sending? What people will hear is that the exchanges cannot be trusted to make rational decisions and that they can close on a whim. Traders would be afraid of being stuck in bad trades as they wait for the markets to open. I do not think the exchanges want to risk losing the trust that they have worked so hard to earn.
Thanks Al. Agree about incentives for exchanges, but exchanges are subordinate to governments, which have their own incentives.
Hi Al, if there is a short covering, what is the target range you will think of?
There is a wedge on the daily chart. The top of the wedge is always a magnet. But that might be too far up.