September low double bottom for possible year end rally
Updated 6:46 a.m.
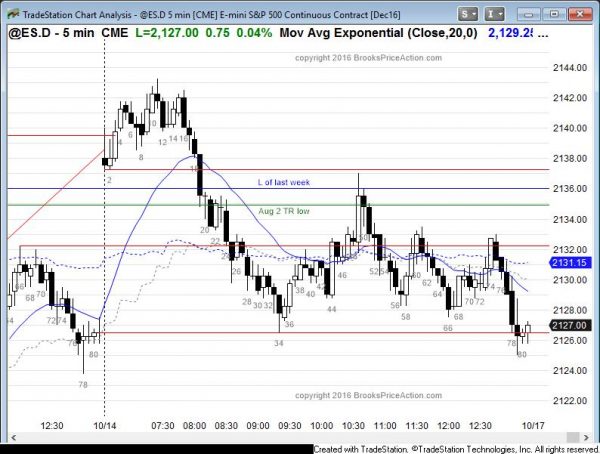
The Emini gapped up and tested Wednesday’s high, the top of yesterday’s bull channel, and last week’s low. Yet, the 1st 2 bars were dojis. This increases the probability that the initial rally attempt will not get far before going sideways to down. The location is good for the bears, which means that there is at least a 50% of a swing down at some point today.
While it is possible that this will be a successful strong breakout above a bull channel, the odds are only 25%. Yet, if the bulls can create a series of big bull trend bars closing on their highs, they would convince traders that this is an early low of the day.
The Emini is Always In Long. Because of the 1st 2 dojis at resistance, and the low probability of a strong bull breakout above a bull channel, the odds are that the best the bulls will get is a 5 – 10 bar rally and then a trading range. There is no top yet and the bears will probably need at least a micro double top before they can create a swing down.
Pre-Open Market Analysis
The Emini yesterday reversed up strongly from below the September low. The reversal therefore created a High 2 bull flag on the daily chart. Hence, yesterday is a buy signal bar. Furthermore, there is a seasonal tendency for the stock market to rally from mid-October to the end of the year. Yet, the tail on the top of yesterday’s bar weakens the buy signal. Therefore the odds still favor a test below the 2084 July 2015 high before a new all-time high.
Because the monthly chart had 7 consecutive bull trend bars, it is in a buy climax. This therefore lowers the probability of a strong rally from here. Additionally, the Emini is close to the July 2015 high of the 2 year trading range. It might be within the magnetic field of that support level. If so, it might continue to work lower, despite yesterday’s buy setup.
The Emini is confused. Traders therefore need clarity. A strong reversal up or down can provide that clarity. Yet, if there is a strong bear breakout, the bulls will probably buy just below 2084 because the rally on the monthly chart since February was so strong. A climax usually results in a pause in a trend. Hence, a reversal into a bear trend is less likely.
Break below the trend line
I have been talking about the bull trend line on the daily chart for several weeks. The bears finally broke below it on Tuesday. The bulls reversed the Emini up yesterday. Because the tail on the top of yesterday’s bar on the daily chart was disappointing for the bulls, the odds of a strong reversal up are less. If the Emini goes sideways to up for 1 – 3 days and then falls again below the September low, the odds of a move below the 2084 July 2015 high within a few weeks would be 60%. The bulls therefore need a strong rally over the next few days to make traders believe that the bear breakout below the trend line and the September low will fail.
Emini Globex sessions
Yesterday’s rally continued overnight and the Emini is up about 8 points. It therefore might gap up.
Forex: Best trading strategies
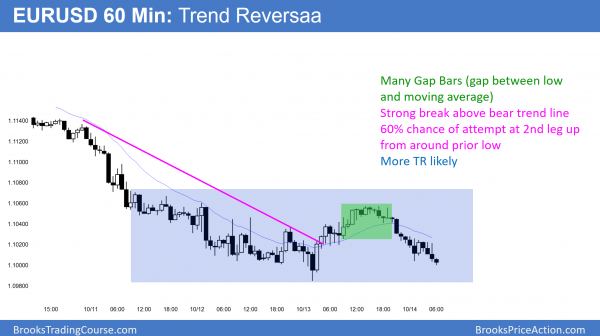
While the EURUSD 60 minute chart sold off overnight, the selloff lacked consecutive big bear bars closing on their low. It is therefore more likely a bear leg in a trading range. Furthermore, the series of Gap Bars (bars completely above the moving average) and break above the bear trend line are signs of strong bulls. The odds are that there will soon be a 2nd leg up.
While the 60 minute chart had a sell climax on Wednesday, yesterday’s rally was not strong. Yet, the odds still favor at least a 2 legged move sideways to up after a big sell climax. Therefore bulls will probably buy a selloff to above yesterday’s low.
While the bears can break below Thursday’s low, there will probably be buyers below. The odds favor an attempt at a major trend reversal up from around yesterday’s low. Yet, sometimes the bulls will not get aggressive until there is a lower low. As a result of how extreme the selling has been this week, bears will begin to look to sell rallies instead of at the low. The odds are that the EURUSD Forex chart will trade sideways to up for at least another day.
Summary of today’s S&P Emini futures price action and what to expect tomorrow
While the Emini gapped it, the breakout failed. It had a 2nd entry sell signal from the failed breakout above the top of the bull channel, yesterday’s high, and the 60 minute moving average.
There was a 75% chance that the bull breakout above the top of the bull channel would fail on the 5 minute chart. The reversal down led to a bear swing. Today is a sell signal bar on the daily chart for Monday.
See the weekly update for a discussion of the price action on the weekly candlestick chart and for what to expect going into next week.
Traders can see the end of the day bar-by-bar price action report by signing up for free at BrooksPriceAction.com. I talk about the detailed S&P Emini futures price action real-time throughout the day in the BrooksPriceAction.com trading room. We offer a 2 day free trial.
When I mention time, it is USA Pacific Standard Time (the Emini day session opens at 6:30 am PST, and closes at 1:15 pm PST). You can read background information on the intraday market reports on the Intraday Market Update page.


Today is a sell signal bar on the daily chart for Monday.
Hello Al, I just don’t get this please. Why is today a sell signal bar????
Henry Vujica
Hi Henry,
Today’s bar is a Low 1 sell setup on daily chart.
Al’s weekly report will be out soon so you can review chart with Al’s commentary there.
It is a pullback from a bear breakout. It has a bear body so it is a low probably Low 1 sell signal bar.
Al,
Sorry about the confusion… I meant the low of Sept being on the 12th at 2100 and the low of October 13th at 2107.
Hi Richard,
You are using overnight low figures, whereas Al’s charts are day session only.
Globex low for September was 2100.25 on the 12th, and day session same day was also the September low at 2110.50.
And yes, the DB second low was yesterday, Thursday Oct 13th day session, at 2107.75.
Hope that clarifies situation.
Hey Al,
Your headline statement mentions September low DB. Are you referring to today’s 2108 low and the low of the 11th sell off?
Thanks- Richard