September FOMC fed interest rate hike stock market breakout
Updated 6:52 a.m.
The Emini gapped up and sold off on the open. Yet, there was a bull body after the 1st big bear bar. This therefore is a sign that the bears lack conviction. Hence, it increases the chances that the selloff is a bear leg in what will probably become a trading range.
There is support at all 3 moving averages below. This is especially true because they are flat and close together.
While the bulls will buy this selloff down to support and try to create an opening reversal and an early low of the day, it is more likely that the bulls and bears are balanced. Hence, a trading range day is likely. The daily ranges have been big enough so that day traders have been able to swing trade up and down. That will probably be true again today.
The Emini is currently deciding if the 1st swing will be up or down. With 3 dojis in the 1st 4 bars, the Emini might trade sideways for an hour or more as it decides. This type of open, especially in an 8 day trading range, reduces the chances of a strong trend day.
Pre-Open Market Analysis
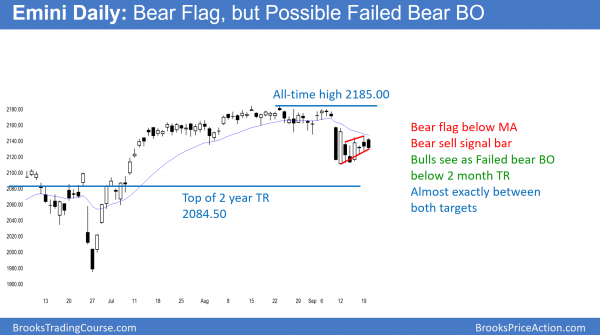
The Emini has been in a tight trading range for 7 days. It is therefore neutral going into tomorrow’s FOMC announcement. Whether or not the Fed raises rates tomorrow, the odds still favor one more leg down after the strong bear breakout 2 weeks ago. Furthermore, whether or not there is another leg down, the odds also favor at least one more rally to a new high.
Therefore, if there is a selloff on the report, bulls will probably buy it. If there is a strong rally to a new all-time high, bears will sell it. The is especially true if the rally reaches the 2200 resistance area.
Because the Emini has been in a tight trading range, the odds are that it will continue today. It is sideways on the daily chart. Hence, the odds of a lot of trading range price action on the 5 minute chart are also higher.
Emini Globex session
The Emini is up 7 points and in the middle of yesterday’s range. If the Emini opens around here, the selloff at the end of yesterday would be a Higher Low Major Trend Reversal. Because this rally is in the middle of an 8 day tight trading range, it is more likely a bull leg in the range rather than the start of a bull trend.
Most likely, the Emini will remain sideways going into tomorrow’s FOMC report. Yet, traders should be open to the breakout coming before the report.
Despite the tight range on the daily chart and the multiple reversals over the past 2 weeks, the moves on the 5 minute chart have been big enough for swing trades up and down. That will probably continue today.
Forex: Best trading strategies
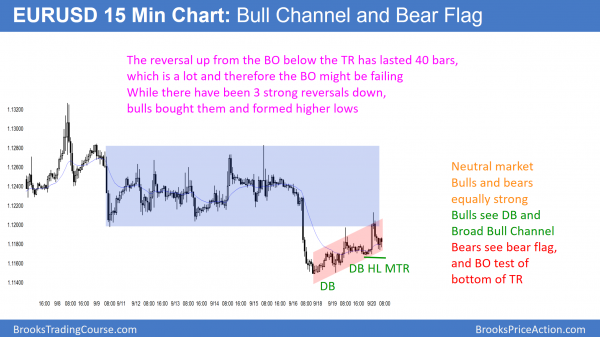
The 15 minute EURUSD Forex market broke below the trading range. Yet, the pullback from the breakout has lasted 40 bars. Whenever a pullback lasts 20 bars, the market is back to neutral. Furthermore, it is in the middle of a month-long tight trading range and a 6 month trading range.
The daily chart of the EURUSD Forex market is in the middle of its 6 month trading range. Because it is going sideways after nested Head and Shoulders Tops, it is in Breakout Mode. There is an equal chance of a break below the neck line and a break above the lower highs (right shoulders). Because tomorrow’s FOMC announcement is an important catalyst, Forex markets might wait until the report before breaking out. Therefore, the odds are that today will be mostly a trading range day.
When a market is in Breakout Mode, there is a 50% chance that the 1st breakout will fail and reverse. Furthermore, there is a 50% chance that the eventual breakout will be up, and a 50% chance it will be down.
Overnight EURUSD Forex sessions
While the EURUSD rallied sharply overnight, the rally lasted only about 15 minutes, covered only 40 pips, and totally reversed back to around yesterday’s close. Big Up, Big Down means Big Confusion. Hence, traders are still unwilling to hold onto positions. The market is in breakout mode, and traders are mostly scalping.
Summary of today’s S&P Emini futures price action and what to expect tomorrow
Today was a bear inside day on the daily chart. It is a sell signal bar for tomorrow. The bulls want the bear breakout to fail and for the Emini to rally to a new high.
Today was the 8th day in a tight trading range below the moving average. It is therefore neutral going into tomorrow’s 11 a.m. FOMC announcement.
While the daily chart is slightly bearish and the odds favor a test below the July 2015 high, the weekly and monthly charts are bullish. The odds favor a new high whether or not there is a deeper pullback first.
See the weekly update for a discussion of the price action on the weekly candlestick chart and for what to expect going into next week.
Traders can see the end of the day bar-by-bar price action report by signing up for free at BrooksPriceAction.com. I talk about the detailed S&P Emini futures price action real-time throughout the day in the BrooksPriceAction.com trading room. We offer a 2 day free trial.
When I mention time, it is USA Pacific Standard Time (the Emini day session opens at 6:30 am PST, and closes at 1:15 pm PST). You can read background information on the intraday market reports on the Intraday Market Update page.


Hi Al,
After a wedge top, is it common where first leg is down but second leg is mainly sideways? Looking at hourly chart, it was third push up to 1.1213 (1.1177, 1.1197, 1.1213) and looks like it is still in first leg down so would you prefer to take partial profits around 1.1174/1.1176 or you would prefer to take full profits if you were in a trade from 1.1195 or 1.1210?
Many Thanks
I agree with your wedge top, although I would call it a wedge bear flag. Because the chart has been mostly sideways for more than 20 bars, I trade it like a trading range. I scalp out completely and then look for the next trade. Until I think the chart has entered a new trend, I scalp.