September Emini 100 point correction
Updated 6:55 a.m.
The Emini gapped above Friday’s bull flag, but formed a tight trading range. This increased the chances for a lot of trading range price action today and reduced the chances for a strong trend up or down. Because the all-time high is only 10 points higher, the Emini could easily make a new high today. Yet, the bulls need a strong breakout with follow-through before traders will swing trade.
Because the open is testing the resistance of yesterday’s high and the all-time high, traders will watch for an Opening Reversal down for a possible early high of the day. Just like for the bulls, the bears need a strong breakout to convince traders that they have taken control.
Most likely, today will be a trading range day. Hence, traders expect a 2 – 4 hours swing one way and then an opposite swing. The Emini is currently deciding which will be 1st. Since it is at resistance and Always In Short, and early bear swing is slightly more likely.
Pre-Open Market Analysis
Last week was a buy signal bar on the weekly chart. Yet, it was also the 6th consecutive doji in a tight trading range. While the weekly chart is still in a bull trend and there are measured move targets above around 2200 – 2220, these doji bars represent exhausted bulls.
Furthermore, the gap above the 2 year trading range will probably close. When a gap forms 20 or more bars into a trend, it is more likely an exhaustion gap than a measuring gap. This gap is about 100 bars into the trend. Hence, the odds are that the 2 year trading range is the Final Bull Flag.
Bears unable to create big bear bar on daily chart
Because the bears have failed several times in the past few weeks to create a big bear breakout on the daily chart, and because the trend leading up to the August trading range was up, the odds still slightly favor one more new high. However, the bears have done enough to create a credible top, and a 100 point correction can begin at any time.
“Never Short a dull market?”
That is a saying on Wall St., but since most tops come from some type of trading range, it clearly cannot be reliable. The truth is that a dull market on one time frame is just a bull flag on another. Hence, it can be the Final Bull Flag. For example, the daily chart has been in a tight trading range for 2 months. Yet, it is only a pair of dojis in a buy climax on the monthly chart.
Therefore, just because the daily chart is dull does not mean the odds favor a new leg up. Yet, the tight bull channel and the momentum do favor at least one more brief new high. However, the odds also favor this 2 month trading range as being some kind of a top, like the 1st 2 small legs up in a Wedge. As a result, there might be one more push up before the Emini corrects for a month or two.
Emini Globed session
The Emini is up 1 point the Globex session and the range has been small. This is consistent with the 2 month tight trading range, and it increases the chances of another trading range day.
Forex: Best trading strategies
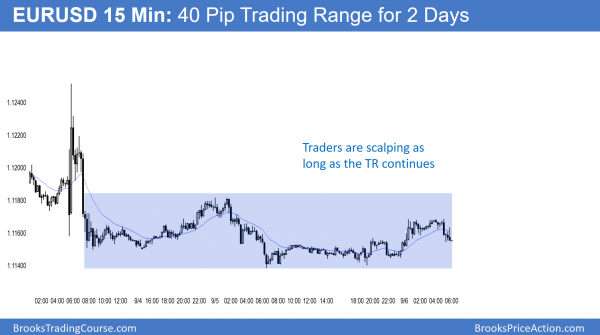
The 15 minute EURUSD Forex chart has been in a 40 pip tight trading range for 2 days.
The EURUSD had a 2 legged rally on Friday on the 60 minute chart. This was likely as a result of the Spike and Channel sell climax that ended on Thursday. As expected, bulls took profits on the test of the neck line of the Head and Shoulders top.
The bears are hoping that the test was just a pullback in a new bear trend. They need follow-through selling this week. More likely, after 5 sideways day, today will be mostly another sideways day. Support below is the August 5 higher low, and resistance above is Friday’s high.
Overnight EURUSD Forex sessions
The EURUSD monthly Forex chart has been sideways for 4 months, and 3 of the months have been dojis (including September, so far). Most of the bars of those 4 months have been in tight trading ranges on the 5 minute chart. The daily chart has been in a tight trading range for 6 days. While it will breakout soon, traders are mostly scalping while waiting for the breakout.
Summary of today’s S&P Emini futures price action and what to expect tomorrow
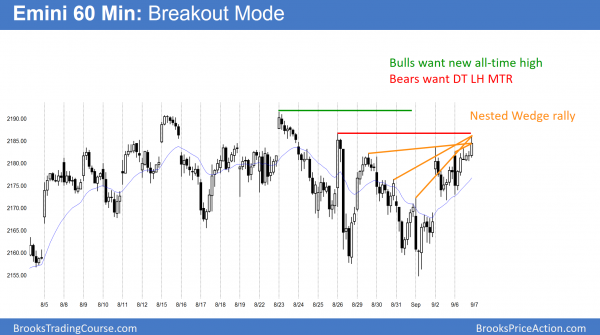
The 60 minute chart of the Emini is testing the August 26 major lower high. If the bulls get above it, they will then try to break to a new all-time high.
The Emini spent most of the day in a tight trading range just below last week’s high. The weekly buy signal triggered late in the day. The odds favor a test the all-time high this week. Because the probability slightly favors the bulls over the next week or two, traders have to be especially ready for a surprise reversal down after the test. Furthermore, a reversal down can begin without the Emini going any higher.
The odds over the next month or two favor about a 100 point pullback once the current rally ends.
See the weekly update for a discussion of the price action on the weekly candlestick chart and for what to expect going into next week.
Traders can see the end of the day bar-by-bar price action report by signing up for free at BrooksPriceAction.com. I talk about the detailed S&P Emini futures price action real-time throughout the day in the BrooksPriceAction.com trading room. We offer a 2 day free trial.
When I mention time, it is USA Pacific Standard Time (the Emini day session opens at 6:30 am PST, and closes at 1:15 pm PST). You can read background information on the intraday market reports on the Intraday Market Update page.


