Obamacare repeal is not cause of May June correction
Updated 6:55 a.m.
While the Emini gapped above yesterday’s high, it sold off and closed the gap. In addition, the 1st several bars had bear bodies and prominent tails. But, the bears were unable to create consecutive big bear trend bars. The open therefore looks like a continuation of yesterday’s trading and of the trading in the 2 week tight trading range. Consequently, the day is beginning like another trading range day. Hence, the odds are against a strong trend day at the moment.
The high reversed down from just above last week’s high. The bears therefore see this as a double top lower high major trend reversal on the 60 minute chart. Since the Emini is likely to begin a 100 point selloff at some point in the next few weeks, any top attempt can be the start. Yet without a strong downside reversal, it is more likely that any selloff will be minor. If instead the Emini reverses up and breaks to a new high, this top would end. The odds of a bear trend day would be much smaller.
The bulls want this selloff to reverse up from around yesterday’s high and the moving average. They hope to get an opening reversal up and a bull trend day. Yet, they could not keep the gap open, and they could not create a bull trend bar in the 1st several bars. Hence, the odds are against a strong bull trend day Yet, if there is a reversal up with consecutive strong bull trend bars, traders will swing trade for a possible bull trend day and a new all-time high.
Pre-Open market analysis
While the Emini sold off sharply yesterday, it reversed up from the bottom of the 8 day trading range. Since last month’s high is a buy signal on the monthly chart and the monthly chart is in a strong bull trend, the odds are that the Emini will trigger the buy within the next week or two. This is because traders want to know if there will be another leg up, or if there will be more sellers above.
If the Emini rallies to a new all-time high, traders will watch for a reversal down from the top of the wedge created from the April 5 and April 26 highs. If there is a reversal, it would be a wedge higher high major trend reversal.
Since the buy climax on the weekly chart is extreme,there is a 70% chance of falling below its weekly moving average in the next 2 months. Consequently, there will probably be sellers above last month’s high.
Because a reversal down is likely to start within the next few weeks, it could start at any time. Therefore, the Emini does not have to 1st trigger the buy signal on the monthly chart 1st.
Overnight Emini Globex trading
The Emini is up 4 points in the Globex market. Yesterday was an entry bar for the breakout above a 2 week High 2 bull flag. Furthermore, the bull trend over the past 3 weeks was strong. It therefore will likely have at least one more leg up on the daily chart. Finally, the all-time high is about 5 points above. Since it is a strong magnet, the odds are that the Emini will go at least a little higher over the next few days.
Since today might gap up, there is an increased chance of a trend day. Because the Emini is at the resistance of the all-time high and it is breaking above a tight trading range, the trend could be down. The 2 week range would therefore be a final bull flag. Furthermore, this rally would form a double top with the March high.
Yet, the momentum up over the past 3 weeks is strong enough to make a new high likely. Therefore if the gap up stays open, today could be a big bull trend day that breaks to a new all-time high. In addition, it might close above the 2,400 Big Round Number.
Traders know that most days over the past 2 weeks have been trading range days. However, today has a higher probability of being a trend day. Therefore, traders should look for possible swing trades if a trend begins.
EURUSD Forex market trading strategies
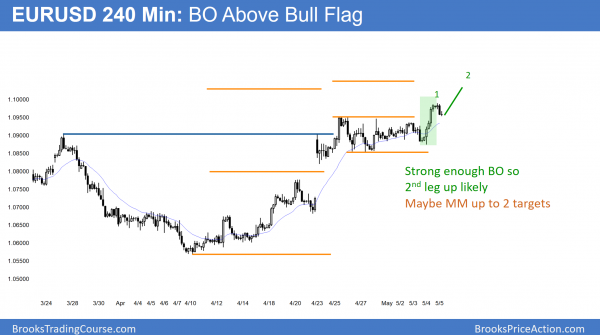
The overnight breakout above the 8 day trading range was strong enough to make at least one more leg up likely. There are 2 measured move targets above.
The EURUSD Forex market has been rallying for 4 weeks. Additionally, it broke above the top of its 6 month trading range. Furthermore, it broke above its 8 day trading range last night. The momentum up from the overnight breakout was strong enough to make at least one more leg up likely. Logical targets for the rally are measured moves above, about 100 pips above the 8 day range.
The 8 day range might be the final bull flag in the 4 week rally. Yet, the momentum up was strong yesterday. Hence, the bears will probably need at least a micro double top before they can begin a leg down.
The EURUSD Forex market is still in the middle of a 2 year trading range Therefore, even if the rally continues for a measured move up based on the 500 pip tall 6 month trading range, it would still be in the 2 year range. Furthermore, that range is a bear flag on the monthly chart.
Overnight EURUSD Forex trading
The EURUSD 5 minute chart pulled back from yesterday’s breakout. In addition, it just rallied back to yesterday’s high. A reversal down from here would therefore be a micro double top. Hence, it would meet the minimum requirement for the bears. They want at least a small 2nd leg up from yesterday’s bull breakout. This is because a 2nd reversal down has a higher probability of leading to a major reversal.
But, the breakout is also a breakout on the 240 minute chart. The bears want their micro double top to form on the largest time frame where they can see the breakout. Hence, the 5 minute double top will probably not be enough. Consequently, the odds still favor at least slightly higher prices.
Summary of today’s S&P Emini futures price action and what to expect tomorrow
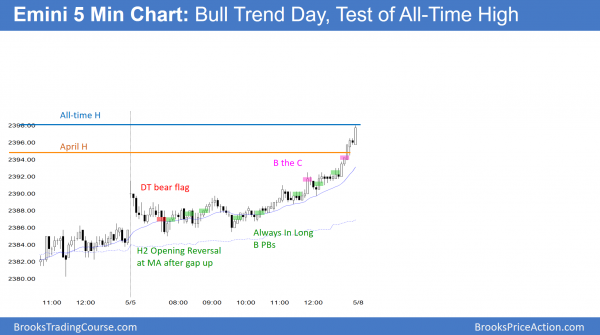
The Emini reversed up from the moving average and yesterday’s close, but the bull trend was weak until the end of the day. It finished with a Buy The Close test of the all-time high.
The Emini pulled back from a gap above yesterday’s high. It then rallied from an opening reversal. While the rally was weak, it broke above the April high. It therefore triggered a buy signal on the monthly chart. Furthermore, it tested the all-time high to the tick. While the odds favor higher prices next week, the breakout will probably reverse down within a couple of weeks and fall below the weekly moving average.
See the weekly update for a discussion of the price action on the weekly candlestick chart and for what to expect going into next week.
Traders can see the end of the day bar-by-bar price action report by signing up for free at BrooksPriceAction.com. I talk about the detailed S&P Emini futures price action real-time throughout the day in the BrooksPriceAction.com trading room. We offer a 2 day free trial.
When I mention time, it is USA Pacific Standard Time (the Emini day session opens at 6:30 am PST, and closes at 1:15 pm PST). You can read background information on the intraday market reports on the Intraday Market Update page.


Hi Al, how do you determine if the price action is a parabolic wedge top/bottom that might has a reversal or strong bull/bear trend which would resume after pullback. Since parabolic wedge is climatic, and strong bull/bear trend has climatic bars too and likely to have trend resumption after pullback
Most reversals have a 40% of an opposite swing, and a 60% chance of either a trading range or trend resumption within about 10 bars. If there is an good signal bar, a parabolic wedge has a 50% chance, especially in the 1st hour or so. If there is even a weak signal bar, the odds favor a pullback lasting at least 10 bars. Traders then watch for trend resumption, or an endless pullback followed by a strong opposite breakout. For example, a parabolic wedge top often pulls back in a tight bear channel for 10 – 20 bars, and then has consecutive big bear bars. This usually results in a measured move down.
If the parabolic wedge reverses at a significant magnet (like the top of a 5 – 10 day trading range), and it is also at other magnets, the odds of a reversal go up. If the market has been in a trading range, the odds of a failed breakout and a reversal are higher. If the parabolic wedge rally if far beyond magnets, the odds of a strong, continued trend goes up.