Posted 6:56 a.m.
The Emini gapped above yesterday’s high and had a Trend From The Open Bull Trend for several bars. The rally was strong enough so that bulls will probably buy the 1st reversal down. It was also strong enough to make a bull trend day more likely than a bear trend day. Today could become a Spike and Channel bull trend. It could also soon go sideways for 2 or more hours, and then get trend resumption or reversal later in the day. At the moment, the odds favor higher prices, but the tails and shrinking bodies increase the chances of a pullback or trading range soon.
Whenever there is a strong open like this, there is the possibility of a parabolic wedge top and early high of the day. The bears would probably need at least one more push up. If there is a parabolic wedge and then a reversal, the reversal often is a tight trading range that is sloped down. It often takes 10 or more bars before the bears get a breakout. The bulls try for a bull breakout of what they see as a bull flag. If a parabolic wedge top forms, traders will be ready for a reversal and for trend resumption after about an hour of sideways to down trading.
Pre-Open Market Analysis
S&P 500 Emini: Learn how to trade second signal candlestick patterns
The Emini has been in a tight trading range for 2 months. There are 5 trading days left to May. April was a sell signal on the monthly chart, and there were buyers below its low last week. The buyers did not lift the Emini far yet. That means that the Emini might dip below the April low one more time before May ends next Monday.
The question is whether May will close below April. If so, the bears will have a stronger case for lower prices, especially if May closes on its low and far below the April low. A measured move down based on the height of the 2 month trading range (Head and Shoulders Top) would take the Emini down to around 1950, which is also about a 50% pullback of the rally that began in February.
Will this selloff happen? We will find out soon. For example, if the Emini gaps down this week and the gap stays open all day, the gap would create an island top. An island top, even if it forms in a trading range, can have 5 – 10 bars of follow-through selling. This would be enough time to reach 1950.
The April low and the December 31 low are both within a tick of each other and around 2026, which is not far below. The bulls want another reversal up from that level, like they got last week. If they get it, and especially if it is strong, the bears might give up. This could result in a new all-time high.
Alternatively, if the Emini falls again below the April low, this would trigger the monthly sell signal for a 2nd time. A 2nd signal has a slightly higher chance of success. If the Emini breaks strongly below 2026 and if May closes far below on next Monday, traders will begin to look at 1950 as the next support.
The 11 week bull micro channel on the weekly chart is a sign of strong bulls. It is also climatic and a sign of exhausted bulls. The buyers usually return within 3 bars (weeks). We are now at the start of the 5th week and there is no reliable reversal back up yet. Every bar that gets added to the developing tight trading range on the weekly chart increases the chances of a deeper pullback, like down to the 1950 target from the daily chart.
Trading ranges can last a long time. Of all possible outcomes, a continuation of the range on the daily chart is more likely than anything else, even if the Emini again breaks below the April low or tests near the top.
Because of the monthly sell signal and the lack of a strong reversal up from below April’s low, traders need to be prepared for a surprisingly big bear breakout by the end of May. The odds are against it, but the context is consistent with it. If the Emini begins to sell of strongly within the 5 remaining days, bears should look for a swing trade down to around 1950.
The reversal up last week was strong enough to have a 2nd leg up. The Emini is up 12 points in the Globex session. If the Emini opens right here, that gap up would meet the minimum requirement for a 2nd leg up. However, a Leg 1 – Leg 2 measured move is a more likely outcome for a reasonable minimum goal. That is just below 2080, and around the May 10 lower high. That day ended with a buy climax on the 60 minute chart and its high was never tested. This is another reason why it is a magnet over the next week. Will the Emini continue up to a new all-time high? Trading ranges resist breakouts. It is more likely that there will be sellers in the 2080 area and another leg down that adds more bars to the range.
I am travelling starting Wednesday and I might not post again until Monday, May 30.
Forex: Best trading strategies
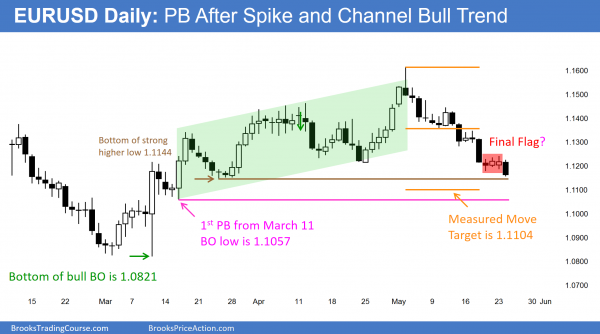
The daily EURUSD Forex chart is near support after a series of sell climaxes and can bounce at any time.
The daily chart of the EURUSD had 3 small days after a series of sell climaxes over the past 3 weeks, and it broke to the downside overnight. It is trading above the support of the bottom of the trading range that began immediately after the huge March 10 bull reversal up from 1.0821. May 13 is a credible measuring gap, and the measured move projects down to around 1.1100. This is only about 55 pips below the overnight low. The EURUSD does not have to get there, but when there is a clear gap, and then a breakout pullback test of the breakout point (the May 17 high failed to close the gap below the May 10 low), there is about a 50% chance that the bear leg will reach the measured move target, whether or not it bounces 1st.
If the EURUSD Forex daily chart rallies strongly, the selling over the past 4 weeks has been strong enough so traders believe the 1st reversal up will not break above the top of the yearlong trading range. More likely, it would be followed by a test back down. If the rally does not close the May 13 gap, the EURUSD might then continue down to the 1.1100 measured move target. This rally would be a lower high major trend reversal and a Head and Shoulders top on the daily chart.
Even though the selling from the May 3 high has been in a series of sell climaxes, which increases the chances of a 2 legged rally, there is no bottom yet. When there is a trading range late in a bear trend, especially near support, it is often the Final Flag. This means the bear breakout often reverses back up and begins a swing up. The 3 day trading range might be the Final Bear Flag, but there is no sign of a reversal yet and there is still room to the support of the measured move target and the March 16 bottom of the bull channel at 1.1057.
There is the support of the strong March 24 higher low of 1.1144. Since this is the 3rd push down from the May 13 gap, the Forex market might see this as a wedge bottom at support. If so, the EURUSD Forex chart might bottom in the next day or two and begin TBTL Ten Bars, Two Legs up. However, until there is a reversal, the odds favor reaching the measured move target before there is a swing up.
Because the EURUSD Forex chart is in a sell climax and near support, a reversal up can come at any time. However, it is more likely to reach the Leg 1 = Leg 2 target around 1.1100 1st.
I am travelling starting Wednesday and I might not post again until Monday, May 30.
Summary of today’s S&P Emini futures price action and what to expect tomorrow
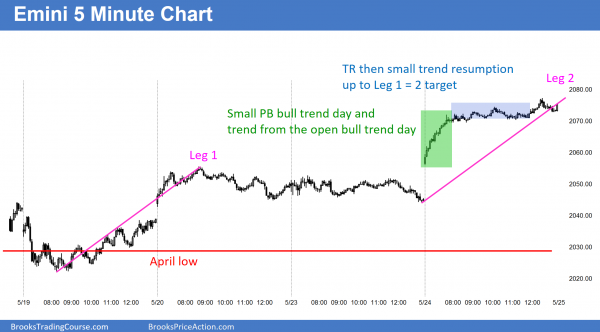
The Emini gapped up and rallied in a Trend From The Open bull trend for the 1st hour, and then entered a trading range. It had a trend resumption up in the final hour and reached the Leg 1 = Leg 2 measured move target, where Leg 1 was the Thursday and Friday rally.
The Emini rallied strongly for the 1st hour, and then entered a trading range, which is a breakout mode setup for either trend resumption up or trend reversal down. The bulls got trend resumption up to the Leg 1 = Leg 2 measured move target. The next magnet is the May 10 high of 2079.75. That was a major lower high that led to a reversal down below the April low.
The bears see today’s trading range as a potential top. They don’t mind early trend resumption up tomorrow as long as it fails within the 1st hour. They would then look at today’s 4 hour trading range as the final bull flag. Because today was a buy climax, there is a 75% chance of at least 2 hours of sideways to down trading tomorrow that begins by the end of the 2nd hour. Although it could lead to a bear trend day, a trading range day is more likely, especially since today spent 5 hours in a trading range.
Today’s rally was strong enough so that the odds favor a test of the May 10 high this week. As I wrote several days ago, May might even get above the April high and form an outside up month. If there is strong follow-through buying, traders will begin to see this as a possibility, and it could lead to a quick move to above last month’s high.
See the weekly update for a discussion of the price action on the weekly candlestick chart and for what to expect going into next week.
Traders can see the end of the day bar-by-bar price action report by signing up for free at BrooksPriceAction.com. I talk about the detailed S&P Emini futures price action real-time throughout the day in the BrooksPriceAction.com trading room, and a 2 day free trial is available.
When I mention time, it is USA Pacific Standard Time (the Emini day session opens at 6:30 am PST, and closes at 1:15 pm PST). You can read background information on the intraday market reports on the Intraday Market Update page.


The May 10 high was already taken today. The next lower high is the April 27 high which is not significant so probably the next target is the April 20 high.
I agree that the April 27 high looks minor, but a minor looking lower high is in a TR like this is often very significant. It is common for a minor lower high in a TR to be the 1st high of a double top LH MTR. The odds are that the Emini will try to get above the April high by the end of May (Tues), but if it stalls at the April 27 high, it could reverse deeply.