Posted 7:07 a.m.
The day began with a gap down. Both bulls and bears made money with limit orders. This increased the chances for a lot of trading range price action today. The bulls so far are not getting their follow-through buying. There was a 75% chance of at least 2 hours of sideways to down trading beginning in the 1st 2 hours today. It might have already begun.
The selloff so far has lacked consecutive big bear bars. Also, it is unusual for a strong bull trend to reverse to a strong bear trend. This means that this early selloff is probably a bear leg in what will become a trading range. There is no sign of a bottom yet, and the selloff might even last 2 – 3 hours. More likely, it will begin to convert into a trading range soon. The selling has been strong enough so that the 1st reversal up will probably be sold. It is not strong enough to erase yesterday’s bullishness so it is probably not the start of a big bear trend day. A trading range is likely, which means that the odds favor a swing up at some point. The bears are currently in control.
Pre-Open Market Analysis
S&P 500 Emini: Learn how to trade buy climax candlestick pattern
The 60 minute Emini chart had a 6 day wedge bottom and a reversal up on Friday. A reasonable goal was a 2 legged pullback that reversed up to one or more of the lower highs in the wedge. The next lower high is the April 27 high of 2094. The bears will try to create a double top there. The bulls want a breakout above that level. If they get above that, the next target is the all-time high.
Yesterday was the 3rd day up without a pullback. That is unusual and therefore unsustainable and climactic. The odds are that there will be a 2 legged correction down that lasts a day or two. The bulls want the rally to go directly up to the all-time high. Since the 60 minute rally is climactic, there will likely be a pullback first, and it probably will begin today or tomorrow.
The 5 minute chart had a buy climax yesterday. There is less than a 25% chance of a strong bull trend today, but there is a 50% chance of follow-through buying for the 1st hour or two. There is also a 75% chance of at least a 2 hour sideways to down move that begins within the first two hours.
Bears will watch for an early top or an early strong reversal down. If they get it, they will see this rally as forming a double top with the lower of of May 2nd. It is unlikely that the Emini will fall below the neck line (Friday’s low) for a measured move down. The 3 day rally has been strong enough so that the first swing down will probably be bought and followed by a 2nd leg up.
I want to be clear. The odds are that there will be at least a 2 hour correction today. The odds also favor a swing down within the next 2 – 3 days. The 2 hour correction might grow into that larger correction, or there might be one more push up before the larger correction forms.
The larger correction will probably be bought and followed by at least a test of the top of the current bull leg, which will probably end early tomorrow. The bulls will see a Head and Shoulders Bottom on the 60 minute chart, and the bears will see either a Double Top or a Triangle Bear Flag.
The Emini has been sideways in the Globex market and it down about 3 points.
Forex: Best trading strategies
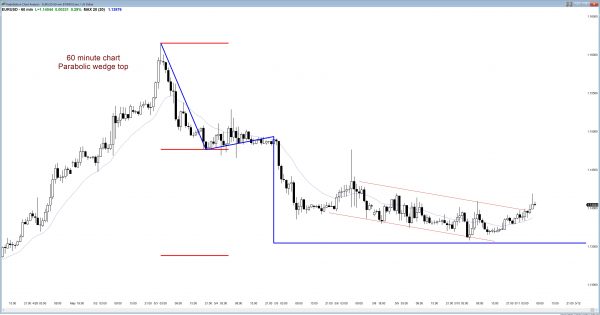
Weak rally on 60 minute EURUSD chart up from measured move targets.
The correction down from the wedge top on the daily and weekly charts continued yesterday, but it has lost momentum. The odds were that it would test the April 29 buy climax low of 1.1344. It got to within 14 pips yesterday and reversed up overnight. The reversal up so far is still within the tight trading range of the past 4 days, and it could break to the downside by Friday’s close.
It could then fall much further and form a big bear entry bar on the weekly chart after last week’s strong sell signal bar and wedge top. However, the bears so far have been unable to drive the EURUSD Forex market down far and fast. This increases the chances of a bounce over the next few days. There is no bottom yet on any time frame, and without a clear bottom or a strong bull breakout, this bear channel can continue down a long ways. It is more likely to bounce this week because the selling has not been strong. That makes this bear swing more likely a bear leg in a trading range and less likely the start of a bear trend.
Just like the April 29 buy climax low on the daily chart was a target for the bears, the May 5 sell climax high of 1.1493 is a target for the bulls. Remember, the selling over the past week was strong enough to create a Big Up, Big Down pattern. That is usually followed by a trading range, which means a rally. Once the rally comes, the bears will see a lower high major trend reversal and expect a 2nd leg down from the wedge top on the daily and weekly charts.
The bulls will see the selloff as just a pullback in a broad bull channel on the daily chart. They expect it to be followed by a another new high, as was the case after every other pullback in the channel. The Big Up, Big Down pattern created confusion. Confusion is a hallmark of a trading range. That makes a trading range for at least a week likely on the daily chart.
The 50 pip overnight rally was good for the bulls because it broke above the 3 day tight bear channel. The problem for the bulls is that the 60 minute chart lacked big consecutive bull trend bars, and the rally only covered 50 pips. Just like the selloff was not strong, the rally also was not strong. The result most likely will be a trading range for a day or two.
Both the bulls and bears need a strong breakout. Neither is getting what it wants. This means that the US sessions have had small ranges and traders have been limited to 10 pip scalps. Until there is a strong rally or selloff, that is the only choice for online day traders.
Summary of today’s S&P Emini futures price action and what to expect tomorrow
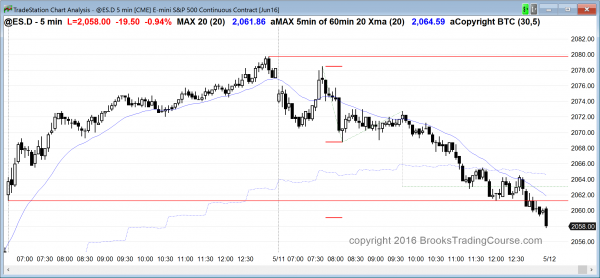
The Emini tried to get follow-through buying, but reversed down sharply from a lower high major trend reversal. After a 2 hour triangle, it sold off to below yesterday’s low.
Today’s selloff totally reversed yesterday’s rally, which was overdone. On the 60 minute chart, the bulls are still expecting a 2nd leg up because of the wedge bottom. It is not yet clear that the pullback from the 1st leg up is complete. It might continue down for another day or so before the bulls will try to create a higher low (Head and Shoulders bottom) and then a 2nd leg up.
Less likely, the double top bear flag on the 60 minute chart will fall below last week’s low, which is the neck line, and reach a measured move down. The most likely outcome is that this pullback ends within a day or so and it followed by another leg up. However, as I have been saying for 2 weeks, the odds are that the Emini will fall below the April low to trigger the monthly sell signal. There probably will be buyers below.
See the weekly update for a discussion of the price action on the weekly candlestick chart and for what to expect going into next week.
Traders can see the end of the day bar-by-bar price action report by signing up for free at BrooksPriceAction.com. I talk about the detailed S&P Emini futures price action real-time throughout the day in the BrooksPriceAction.com trading room, and a 2 day free trial is available.
When I mention time, it is USA Pacific Standard Time (the Emini day session opens at 6:30 am PST, and closes at 1:15 pm PST). You can read background information on the intraday market reports on the Intraday Market Update page.


Hi Al,
You mentioned yesterday that first reversal up (after a buy climax, 6 days down, and a weekly sell signal) will probably be sold. So far bulls lack consecutive bull bars (as you mentioned in your blog), so if we see reversal down from 1.1438/1.1445 level then do you think it will satisfy bears that it is time to sell again for second leg down? Or do bears expect more sideways to up correction to be convinced before they start selling again? Also generally what signs we should be looking for to determine when second leg down is likely to start.
Many Thanks
Saad
I always 1st look at targets. Just like the buy climax bar’s low was a target, now the high of the sell climax bar from 4 days ago is a target. There are many other resistance levels below that price, and many might lead to a reversal back down, but that is the most obvious and therefore most important.