Posted 7:02 a.m.
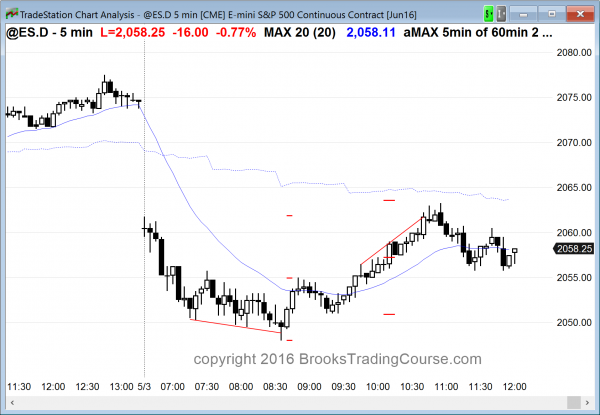
The Emini broke strongly below yesterday’s low, but the follow-through was weak, the 1st 3 bars were dojis, and the breakout bar was exceptionally big, which means a possible exhaustion gap. While the Emini is Always In Short, this is climactic behavior in an oversold market. This is unlikely to result in a strong selloff.
This is probably either a sell climax that will soon create the low of at least the next couple of hours, or it is a bear leg in what will become a trading range. Bulls will be looking for a reversal and a swing up. It is still a Sell The Close bear trend, but most traders will wait to sell closer to the moving average because the odds are that there will not be much more down before a trading range or a swing up begins.
Pre-Open Market Analysis
S&P 500 Emini: Intraday trading strategy for trading range price action
The Emini is still correcting down from a new all-time high 8 days ago. My usual goal for a pullback after a buy climax is TBTL, Ten Bars, Two Legs. The pullback has 2 legs so far, but it is in a tight channel. That means that it might be simply the 1st of two larger legs, where the 1st leg subdivides into 2 or more legs.
The daily chart also has a Final Bull Flag pattern. The trading range from March 17 to April 11 occurred after 20 or more bars in a tight bull trend. When that happens, it is often the final bull flag before a correction. The minimum target is the bottom of the trading range, which might be the April 7 low of 2026. Nothing is exact, but that is a reasonable goal.
That low is last month’s low. Since last month broke above a 2 year trading range to a new all-time high, it is a sell signal bar. If this month trades below that low, it triggers a monthly sell signal. Since the candlestick pattern had a bull body and it followed 2 strong months up, it is a low probability sell signal. This means that the best the bears can reasonably hope to see over the next couple of months is a pullback on the monthly chart. While it is possible that this is the start of a test of the 1800 area again, it is unlikely without at least a micro double top, which means at least one more test back up.
When there is a buy climax, and the 11 week micro channel on the weekly chart was unsustainable and therefore climactic, the Emini usually enters a trading range. The bulls take windfall profits. They want to buy again, but want to wait until the bears are exhausted before they do. What usually happens is that the Emini sells off and searches for a support level, like the bottom of the Final Flag.
The 1st bear breakout below a bull micro channel usually only lasts for 1 – 3 bars before there is trend resumption back up. Once the bull tests the prior high, it usually transitions into a bigger trading range. This is what is probably happening on the weekly chart, which means that the Emini might be sideways for at least another month, and possibly several months.
Yesterday ended about a 100 bar buy climax. I mentioned at the end of yesterday that this had only a 25% of continuing up strongly today. There was a 50% chance of follow-through buying on the open that might last 1 – 2 hours. Even thought the Globex session is down 14 points, the bulls still might get early follow-through buying. Finally, I said that there was a 75% chance of at least 2 hours of sideways to down trading, beginning by the end of the 2nd hour. A reasonable target is always the bottom of the channel, which is either yesterday’s low or the bottom of the triangle of the 1st 3 hours of yesterday. The Emini will probably gap down to that area.
A Spike and Channel bull trend usually is followed by a trading range. This means that today will probably have both a swing up and a swing down. It is impossible to know which will come first. Since the Emini will probably open around the channel low, the odds are slightly greater for the 1st swing to be up.
Forex: Best trading strategies
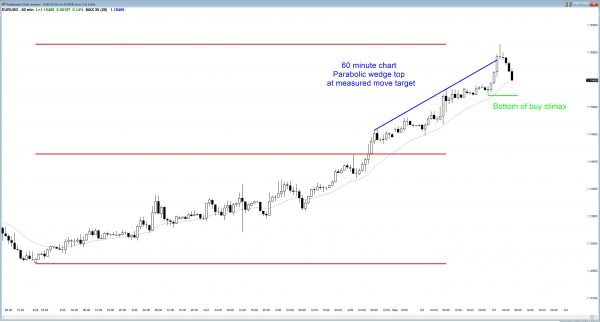
The 60 minute EURUSD Forex chart has a parabolic wedge top at a measured move projection. The minimum target is the bottom of the final leg up, and then a trading range is likely.
The EURUSD is overbought after a 7 day bull micro channel where all of the candlesticks were bull trend bars. The odds are that there will be a pullback soon.
The 60 minute chart reversed down from a bull breakout above a bull channel. The reversal down has lasted 5 hours and it has several strong bear trend bars. A reasonable 1st target is the bottom of the final buy climax at around 1.1520. Since the selloff is already big enough to qualify as a Big Down after a Big Up, the odds are that a trading range has begun. Online daytraders will look to sell the 1st rally on the 60 minute chart, expecting at least one more leg down. There are bulls who bought near the top, but did not yet exit. They want a bounce that will allow them to sell with a smaller loss. There are also bears who missed the sell and want a rally that will allow them to sell higher. With bulls trapped in and bears trapped out, the odds are that the 1st rally will be sold.
It is too early to know if the trading range of the next few days will be shallow, with a bottom around the May 2 low of 1.1520, or if it will be deep. It might test all of the way down to the gap between the April 29 high and below the May 2 low. The reversal down overnight came at a measured move projection up from that gap, so Forex traders obviously are paying attention to it.
The overnight selling on the 5 minute chart lasted more than 50 bars in a tight channel. That is unsustainable and therefore climactic. This means that the EURUSD Forex chart might enter a trading range for several hours. However, the odds still favor a 2nd leg down after any pause, and a minimum target for the bears of 1.1520.
I also mentioned last week that the sell climax in the USDCAD was likely to have a 200 pip bounce. That is probably beginning as well.
Summary of today’s S&P Emini futures price action and what to expect tomorrow
I had to leave early today because of speaking in the futures.io webinar. The Emini sold off to a wedge bottom in the 1st 2 hours. Limit order bulls had many chances to make money. The odds favored a swing up. After a small major trend reversal, the Emini rallied back up to the 60 minute moving average, the high of the day, and yesterday’s low.
The Emini had another reversal day, despite the big gap down and early selling. The Emini has been in a trading range for a month, so two-sided trading like this is more likely.
Today’s reversal up created a micro double bottom on the daily chart, but both bottoms were dojis. This increases the chances of more sideways trading tomorrow.
See the weekly update for a discussion of the price action on the weekly candlestick chart and for what to expect going into next week.
Traders can see the end of the day bar-by-bar price action report by signing up for free at BrooksPriceAction.com. I talk about the detailed S&P Emini futures price action real-time throughout the day in the BrooksPriceAction.com trading room, and a 2 day free trial is available.
When I mention time, it is USA Pacific Standard Time (the Emini day session opens at 6:30 am PST, and closes at 1:15 pm PST). You can read background information on the intraday market reports on the Intraday Market Update page.


Thank Al. I hope doing ok.
Al what do you think of current of rally of the CadUsd it’s that the staring of rally you want to see as you mention before in your intraday.
Thank you.
yes
Thank you.
Wow the USDCAD until now it keep rallying up. i am not sure where will bounce. Now is breaking the bear trend line on the daily chart .