End of quarter window dressing before 5 percent correction
Updated 6:41 a.m.
The Emini gapped down to the 60 minute moving average on the open, and had a weak reversal. This is early trading range price action. Furthermore, it is in the middle of yesterday’s range. In addition, like the past 2 days were mostly sideways. These factors make today likely to be mostly another trading range day.
While it could be the 5th consecutive bull trend day, that is unusual and therefore unlikely. More likely, it will close around the open or maybe a little below.
Since the past several days have had swings up and down, today probably will as well. It might go sideways for an hour or more as it decides if the 1st swing will be up or down.
Pre-Open market analysis
The Emini rallied again yesterday and got to within 12 points of the open of the month. The bulls therefore hope that today will close above the open of the month. Hence, they want a bull bar on the monthly chart. This would therefore be a good follow-through bar after February’s big bull breakout.
Yet, because the body will probably be small, this month will not indicate strong follow-through buying. In addition, the all-time high is at a measured move up from the 2014 – 2015 trading range. Furthermore, the weekly chart reached far above its moving average. Hence, the upside over the next couple months is probably limited.
The bulls have been strong this week. Yet, unless they break strongly to a new high, it is still more likely that this rally is a bear rally. The odds still are that the Emini is in the early stage of a 5% correction.
Possible double top bear flag with the March lower high
Since there is room to the March 21 sell climax high, the odds are that this rally will test that high. At that point, the bears will try to create a double top lower high major trend reversal. The bulls need a strong breakout to a new all-time high. Because that high is a magnet and is pulling the Emini up, the odds are that the rally will get there.
Yet, the rally on the 60 minute chart has had a series of buy climaxes. This means that the Emini will probably pull back for a few days before again trying to reach the March 21 high.
Overnight Emini Globex trading
The Emini is down 2 points in the Globex market. While it rallied for 2 days, the rally has been week. It is therefore more likely a bull leg in what will become a trading range. Hence, the upside over the next few days is probably to around the open of the month. Then, the Emini will probably test the bottom of the developing range at the bottom of Wednesday pullback.
Since yesterday was a triangle, today will probably breakout. The 1st breakout has a 50% chance of reversing. If there is a bull breakout, the rally will probably fail at around the open of the month. In addition, a triangle late in a rally usually becomes the final bull flag. Therefore the upside over the next couple of days is small.
If there is a bear breakout, the bulls will probably buy around Wednesday’s low. Hence, the odds are that the Emini will be in a range for a few days.
Because the bulls want the month to have a bull body on the monthly chart, they will buy. Yet, if they conclude that the month will not close above the open, they might sell out at the end of the day. Hence, a bull breakout today could reverse down in the final hour.
Because the 2 day rally has been weak, the odds are against a strong bull trend day today. More likely, today will be mostly a trading range day. Since it is the end of the month, traders should watch for a test of monthly support and resistance, especially in the final hour.
EURUSD Forex market trading strategies
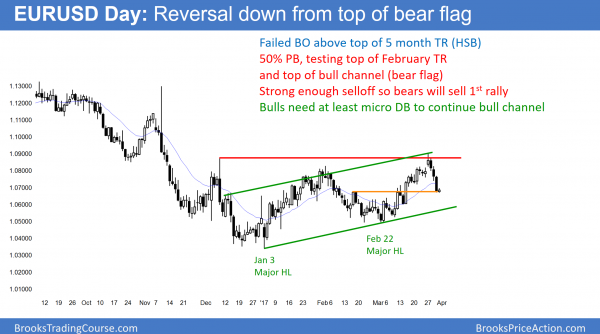
The daily EURUSD Forex chart sold off strongly for 3 days to the middle of the March leg up. It turned down from the top of a bull channel, which is a bear flag. Since it is in a 5 month trading range and this is extreme behavior, the odds favor a bounce within the next 3 days.
The 3 day selloff from above the neck line of the head and shoulders bottom has been strong. Yet, it is still about a 50% pullback from the March rally. Furthermore, the EURUSD is still in a 5 month trading range. Therefore, the bears will probably be disappointed by the follow-through over the next few days. Hence, the EURUSD Forex market should bounce.
Since the selloff has been strong, the odds are that traders will sell the reversal up. This is because bulls who scaled in during the selloff are trapped into a bad long. They therefore will sell out of their longs on a rally. In addition, the bears who did not sell are encouraged by the momentum down. They are eager to sell, but will wait for a pullback.
5 month trading range so both buy and sell setups
The daily chart is still in a 5 month trading range. Traders therefore expect that 80% of breakout attempts will fail. Therefore, the odds are that this selloff will simply be another leg in a trading range, and not the start of a bear trend.
The bulls still believe that this is a pullback in a reversal up from a head and shoulders bottom. Their stop is below the February 22 right shoulder. If the selloff falls below that low, the bulls will conclude that the bull trend has ended. They would then see the chart as a trading range, and not a bear trend. They therefore will hope that the EURUSD daily chart forms a double bottom with that February 22 low. This is true even if the 2nd low is slightly lower.
The bears need a strong breakout below that low and then below the January low. If they succeed, the next target is par.
Overnight EURUSD Forex trading
After a 3 day sell climax, the EURUSD 5 minute chart has been in a 30 pip trading range for the 15 hours. It is just below the 1.0700 support at the top of the February trading range and the bottom of the March 16 pullback in the 4 week rally. While it might fall a little further, the odds are that it will bounce 50 – 100 pips over the next few days. Hence, day traders will scalp and look for a small swing up.
Summary of today’s S&P Emini futures price action and what to expect tomorrow
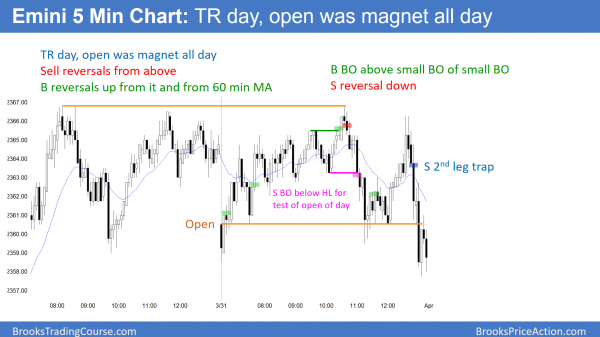
The Emini had a weak rally, but reversed down at yesterday’s high. It sold off again from a 2nd leg trap at the end of the day and closed below the open of the day. Today was a trading range day.
After a weak rally that tested yesterday’s high, the Emini sold off to test the open of the day and the 60 minute moving average. Today is a buy signal bar and sell signal bar for Monday. Yet, after 4 consecutive bull days, the odds are against a big bear day on Monday.
This week is a High 2 buy signal bar on the weekly chart. Yet, the weekly chart had an extreme buy climax. Therefore it is still slightly more likely that the bull flag will fail. In addition, the correction will probably continue down to the weekly moving average and then the close of 2016.
See the weekly update for a discussion of the price action on the weekly candlestick chart and for what to expect going into next week.
Traders can see the end of the day bar-by-bar price action report by signing up for free at BrooksPriceAction.com. I talk about the detailed S&P Emini futures price action real-time throughout the day in the BrooksPriceAction.com trading room. We offer a 2 day free trial.
When I mention time, it is USA Pacific Standard Time (the Emini day session opens at 6:30 am PST, and closes at 1:15 pm PST). You can read background information on the intraday market reports on the Intraday Market Update page.


