Emini weekly sell signal bar after bad JPM earnings
Updated 6:43 a.m.
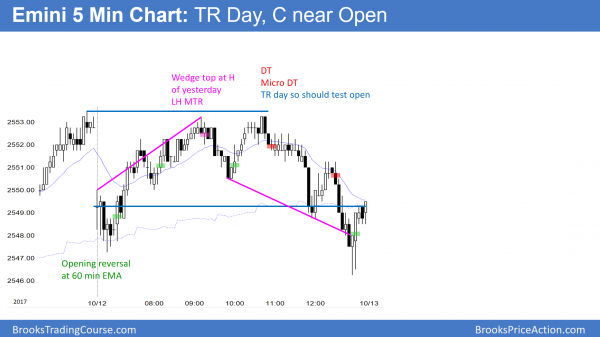
The Emini gapped above yesterday’s high and to a new all-time high, but sold off on the 1st bar. Since yesterday formed a big wedge bottom, the odds are that there will be at least 2 legs sideways to up today. Therefore, the odds favor an opening reversal up that begins within the 1st hour. Yet, the Emini has sold off from a gap up 3 times over the past week. This means that bears are selling new highs and bulls are taking profits. In addition, the big bear bar on the open reduces the chances of a big bull trend day unless the selloff reverses up strongly.
The 2nd bar had a bull body, which is bad follow-through. The big breakout above yesterday’s wedge make at least a small 2nd leg up likely. Finally, the Mini has been in a trading range for 6 days. These factor make a big bear trend day unlikely.
Since the odds are against a big bull trend or a big bear trend day, today will probably be another mostly sideways day. The open of the week is a magnet going into the final hour.
Pre-Open market analysis
The Emini had a trading range day yesterday. Because the weekly and monthly charts are historically overbought, the odds favor a 100 point pullback beginning within weeks, not months. This week so far is a doji bar. That makes it a sell signal bar for next week. Today is Friday and the open of the week is therefore a magnet, especially in the final hour.
Overnight Emini Globex trading
The Emini is up 4 points in the Globex market and it might gap up to a new all-time high. There are measured move targets above and the rally on the daily, weekly, and monthly charts is strong. The odds favor higher prices. Yet, because of the extreme buy climaxes, the odds also favor a 100 point pullback beginning within a few weeks.
Because the Emini has been sideways for 6 days, the odds favor more trading range trading today. Since there were 2 strong selloffs after gaps up within this range, there is an increased risk of a reversal down from a gap up.
However, since the bull trend is strong, there is an increased chance of a bull trend day. Furthermore, buy climaxes often become extreme just before they end. Therefore, traders need to be ready for possibly a very big bull trend day at some point over the next few weeks.
Yesterday’s setups
Here are several reasonable stop entry setups from yesterday. I sometimes also show limit order entries and entries on the close of bars.
EURUSD Forex market trading strategies
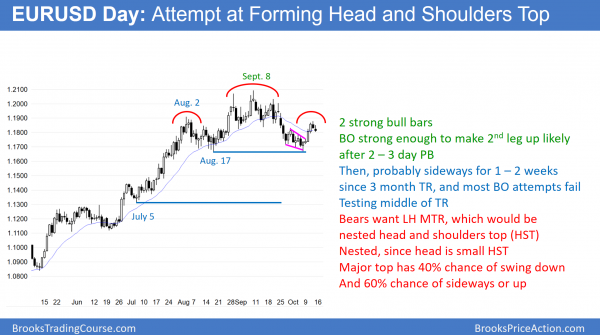
The EURUSD Forex chart is pulling back from a breakout above a small wedge bottom. It is also reversing up from a big double bottom. The reversal is strong enough so that bulls will buy the current 1 – 3 day pullback. Therefore a 2nd leg up is likely.
All trading ranges have reasonable buy and sell setups. In addition, they are always in an early bear trend and in a bull trend. You can see this after there is a successful breakout. For example, if the bears get a successful bear breakout, traders will say that the bear trend began with the September 8 high, which is now within the trading range.
The 3 month trading range on the EURUSD daily Forex chart has a double bottom with the August 17 low. In addition, if the current rally reverses down and there is a breakout below the range, the pattern would be a head and shoulders top.
Most trading range breakouts fail
Since markets have inertia, they resist change. Consequently, no matter how good a bull flag or major reversal is, the trading range is more likely to continue than breakout up or down.
The small wedge bottom had a strong 2 day breakout. Therefore, the odds are that it will have at least a 2nd leg up. The bulls need a strong break above the September 20 major lower high to get a resumption of the bull trend. It would then be in either a bull trend or a bigger trading range.
The bears will sell the rally. They want it to fail to get above the September 20 major lower high. As long as the chart is forming a series of major lower highs, it is in a bear trend. However, they need it to fall strongly below the August 17 major higher low to no longer be in a bull trend. If successful, it would then be in either a bear trend or a bigger trading range.
Overnight EURUSD Forex trading
The daily chart dipped below yesterday’s low overnight, but reversed up strongly in the past 10 minutes. The odds favored a 2nd leg up on the daily chart. This might be the start. However the chart could go sideways for a few more days even if today’s rally breaks above yesterday’s high.
The rally this morning is strong enough on the 5 minute chart to make at least a small 2nd leg up likely.
Yet, it is still in the middle of a 3 day range. Furthermore, the 3 day range is in the middle of the 3 month range. Therefore, traders expect disappointment. Consequently, while the odds of a rally from here are only slightly better than 50%, despite the 60 pip reversal up this morning. The if there is follow-through, bulls will swing trade.
If the rally strongly reverses, which is unlikely the bears will swing trade. Most likely, the rally will not be the start of a strong bull trend, and it will soon either enter a trading range or a weak bull channel.
Summary of today’s S&P Emini futures price action and what to expect tomorrow
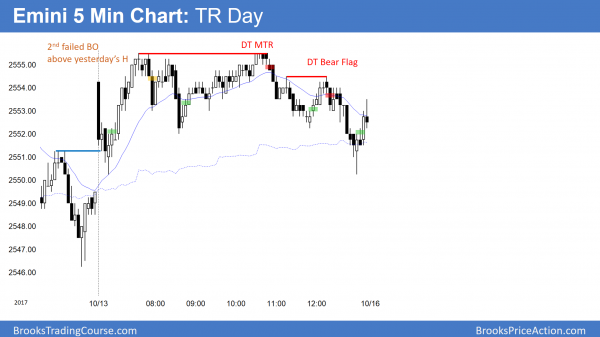
The Emini stalled above yesterday’s high and formed a trading range day. There was a double top major trend reversal.
Today was the 7th trading range day in a tight trading range. Since this week is a small bar after a big bull trend bar on the weekly chart, it is a sell signal bar. Normally, the tight channel would lead to a minor reversal. However, the buy climax is so extreme, the odds are that one of the reversals down will be the start of a 100 point pullback. Yet, since most reversals fail, traders will not believe that the pullback has begun until it is about 50% over.
The bull trends on all higher time frames are strong. In addition, there are measured move targets above. Therefore, the odds favor at least a little higher. But, the pullback will probably begin within the next several weeks.
See the weekly update for a discussion of the price action on the weekly candlestick chart and for what to expect going into next week.
Traders can see the end of the day bar-by-bar price action report by signing up for free at BrooksPriceAction.com. I talk about the detailed S&P Emini futures price action real-time throughout the day in the BrooksPriceAction.com trading room. We offer a 2 day free trial.
When I mention time, it is USA Pacific Standard Time (the Emini day session opens at 6:30 am PST, and closes at 1:15 pm PST). You can read background information on the intraday market reports on the Intraday Market Update page.


Hi Al, can you reexplain the put spread case that you talked about during the trading room session today? I kind of got lost towards the end.
Thanks,
Elie
I said many things, and I was afraid that some of it would be difficult to follow. Because of that, I asked Richard to turn it into an Ask Al post when he gets a chance.
One of the things I said was that when trying to pick a top, a trader needs a reason to suspect that the market will drop far enough to make a profit before his options expire. I gave the example of how the length of the buy climaxes on the weekly and monthly charts compared to the biggest prior ones in the past 30 years. If a trader believed that a 3 – 5% correction would come before the end of the year, buying January spreads make sense.
For example, if a trader bought an at-the-money SPY put spread, maybe buying the 255 and selling the 245 to finance the buy, the numbers would work. That is a $10 spread. My general rule is that I only want to pay about 1/3rd of this for the spread.
This means that if the spread costs around $3, then it would qualify. Then, it the SPY was below 245 at expiration, the spread would be worth $10. After deducting the $3 cost, the trader would net $7, which is about twice what he paid. That means his risk/reward is about 1/2, and that is good (reward is twice the risk). If the spread fell to about half of its value, say $1.50, I would exit and take the $1.50 loss. Remember, each put is for 100 shares, and there a $7.00 profit means per share, or $700 per put.
I talked about many other things, but you will have to wait for the Ask Al, or for the options course. That will be at least a year from now because I still have to finish the Brooks Trading Course, and then I want a break for many months.
Thank you Al! I will be looking more into as I go over the options section in the book.
Hi Al,
Just wondering if you could extrapolate why the opening of the week is a magnet? Is it because the week has been in a trading range so you are assuming the weekly bar will be a doji?
I am responding early in the day on Friday. Both the bulls and the bears want to make this week’s bar on the weekly chart help them next week.
Last week was a big bull trend bar on the weekly chart. Every bull trend bar is a buy climax. The bulls need follow-through buying. This week is a small week so far and therefore bad follow-through. However, at a minimum, the bulls would like it to close on its high. The bears are unlikely to get a big bear bar on the weekly chart this week. At a minimum, they want a sell signal bar going into next week. The minimum for this would be a close around the open of the week.
The bulls want the week to close on its high and the bears want it to close near the middle. Both prices are close. One side will probably win. Both prices are therefore magnets, especially in the final hour.
Got it! Thanks!