Emini wedge top so stock market 5% correction soon
Updated 6:52 a.m.
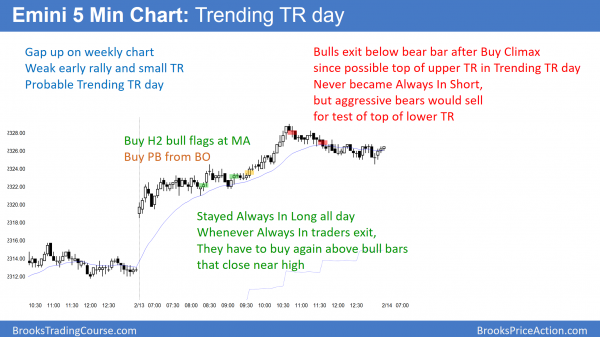
The Emini gapped up and rallied in a trend from the open bull trend. Yet, it is at the top of a channel on the daily chart. This rally is therefore more likely a buy vacuum test of resistance than the start of a big bull trend day. Furthermore, the 4th bar was a bear bar closing on its low. That is bad follow-through. It therefore increases the chances of the rally being a bull leg in a trading range or a climactic high of the day.
While this could be the start of a big bull day, the odds are that this rally will either convert into a trading range soon or reverse down and be an early high of the day.
Pre-Open Market Analysis
The Emini broke up strongly on Thursday. In addition, it had follow-through buying on Friday. Yet, the daily chart has a wedge bull channel. Furthermore, a bull breakout above a bull channel reverses down within 5 days 75% of the time. While this rally could continue up to the measure move targets at 2340 and 2375, it more likely will pullback this week.
There is no reversal down yet. Hence bulls will keep buying. But, the odds are that the rally will probably not last more than a few more days before bulls take profits and bears begin to sell. Therefore, traders will be looking for a pullback starting this week.
Overnight Emini Globex trading
The Emini is up 6 points and therefore might gap up again today. The August 15 and December 13 highs created a channel top, which is around 2320. This rally might therefore continue until it tests that target. Since the momentum up increased last week, the rally might reach the 2375 measured move target without 1st testing the December 30 low. Yet, the odds still favor the test down 1st before the rally reaches the final upside targets.
Since strong bull trends only rarely reverse into strong bear trends, the odds are that the bears will need at least a couple sideways days and a micro double top before they can get a strong reversal down on the daily chart. Hence, bulls will continue to buy pullbacks. Yet, because the Emini is at the top of a bull channel on the daily chart, the odds are that it will reverse down at some point this week.
EURUSD Forex Market Trading Strategies
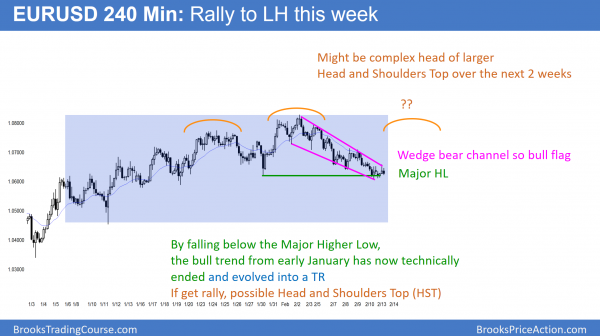
Because the EURUSD 240 minute Forex chart fell below a major higher low, the rally from the January low has probably officially ended. The chart is now in a trading range. Since the 7 day selloff is in a wedge bear channel, the odds favor a bull breakout. Yet, because the EURUSD 240 minute chart is in a trading range, the rally will probably fail around the February 2 top of the rally. Bears will see a reversal down as a right shoulders a head and shoulders top.
The EURUSD 240 minute Forex chart dipped below the January 30 major higher low, but stalled. The chart is probing for a bottom to the trading range. Hence, it could fall much further, including down to the January 11 major higher low. Yet, a trading range is still more likely than a continued bull trend or a reversal into a bear trend. Hence, the odds favor at least one more leg up at some point. If that rally reverses from below the February high, bears will sell. This is because they would see a head and shoulders top.
Overnight EURUSD Forex trading
The EURUSD has been sideways in a 50 pip range since falling below the January 30 low. It is therefore deciding whether there is enough support here for a test of the February high. If not, it will fall to test other major higher lows since the January bottom.
Because the channel down over the past 8 days is tight, the odds are against a test of the February high without more of a base. Hence, the odds favor at least a little more down this week. The next target is the January 16 low of 1.0579, which is only 40 pips below. That is the 1st pullback from the strong January 11 rally.
Since that rally began a Spike and Channel bull trend, the odds are that this current selloff will reach the bottom of the 1st pullback. Once the selloff tests the start of the bull channel, the market usually rallies and creates a big trading range.
That is therefore what is likely here. As a result, traders will sell rallies until the EURUSD Forex chart tests the 1.0570 low. Bears will then take profits and bulls will buy, expecting at least a 100 pip rally.
Summary of today’s S&P Emini futures price action and what to expect tomorrow
The Emini gapped to a new all-time high on the weekly chart and rallied. It pulled back late in the day and formed a trending trading range day.
The Emini gapped up on the weekly chart. Since this is more than 20 bars into the bull trend, the gap will therefore probably close. Yet, it might take several bars (weeks) before doing so.
The bears tried to create a reversal day late today but failed. However, the odds still favor a 5% correction beginning soon. But, this rally is strong and the bears will probably need at least several sideways days on the daily chart before they can create a credible top.
See the weekly update for a discussion of the price action on the weekly candlestick chart and for what to expect going into next week.
Traders can see the end of the day bar-by-bar price action report by signing up for free at BrooksPriceAction.com. I talk about the detailed S&P Emini futures price action real-time throughout the day in the BrooksPriceAction.com trading room. We offer a 2 day free trial.
When I mention time, it is USA Pacific Standard Time (the Emini day session opens at 6:30 am PST, and closes at 1:15 pm PST). You can read background information on the intraday market reports on the Intraday Market Update page.


Al, I’ll 2nd Patrick’s comment, and am sure there’s a multitude of additional 2nds in the readership.
A question re the ~200 major trading firms that you mention in the course:
Do you have any sense of how many of these firms are so big that they cannot but help to lead the market rather than follow it ?
Firms that are so big that they absolutely must scale in, lest they make the market move away too fast ? Doing this not because it’s the optimal trading strategy, but because it’s not possible to establish 100% of a position at the level that is likely the best price ?
More of a curiosity-question, but maybe an answer will assist a deeper sense of the the strength of certain levels of support and resistance.
Thanks, Charles
I think the major firms don’t think of their actions as leading or following. They simply do what they believe is best and don’t care about anything else.
All big firms have lots of traders trading every conceivable style. Therefore, all must have at least some traders who scale in. Look at Icahn. He routinely scales in. All mutual funds are constantly adding and subtracting positions, so they are effectively scaling in and out, although they see it as responding to customer additions and redemptions.
Thanks Al.
I suppose this scenario might be more likely in smaller cap stocks, or any small tradable, rather than in indices as large as ES.
Al, really like the new style trading annotations on the daily updates these and the new videos are all very impressive there is no excuse for us now not to be able to learn and satisfy your aim to help us all become independent Thanks Patrick