Emini wedge lower high major trend reversal in strong rally
Updated 6:45 a.m.
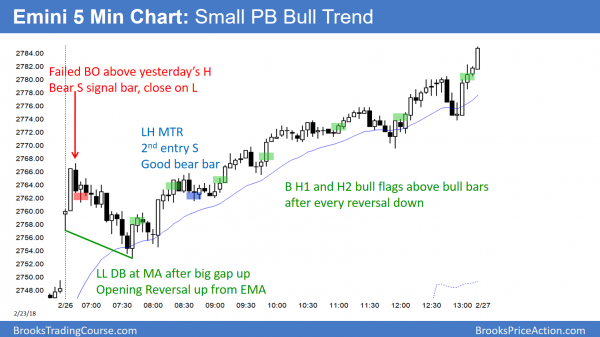
Yesterday had a series of buy climaxes. That increases the odds for exhaustion. An exhausted bull trend typically evolves into a trading range. The early bear bars today are a sign that the bull trend is weakening. They increase the odds of a trading range open. Therefore, the odds are against a strong bull trend day today.
Since yesterday was in a tight bull channel, the odds are against a bear trend without a major trend reversal forming first. That requires a couple hours of sideways trading. Consequently, this is probably a trading range open in a day that will have a lot of trading range trading.
Pre-Open market analysis
Yesterday was a small pullback bull trend. Each leg up had big bull bars. That is therefore a series of buy climaxes. Consecutive buy climaxes usually leads to a couple of legs down.
Furthermore, the Emini tested the top of the wedge bull channel on the daily and 60 minute charts. This is especially important because its behavior this week will tell us whether the bull trend on the daily chart is resuming or if the 3 week rally is a bull leg in a trading range. If traders see this as a wedge lower high, then the Emini might get a couple of legs down over the next few weeks. Support below is around last week’s higher low in the 2700 area.
Alternatively, if there is not a reversal down this week, the odds are that the Emini will continue up to a new all-time high. The momentum up on the daily, weekly, and monthly charts favors the bulls. Furthermore, the bulls are trying to get February to close above its open of 2817.00. Hence, there is a magnet above.
The bear case is not strong
February’s open is probably too far for the bulls to reach it in the 2 remaining days of February. If they decide that they cannot get there by Wednesday’s close, the bulls who bought with that goal in mind might exit. That could cause a small selloff today or tomorrow.
However, the 2 week selloff was surprisingly strong. Consequently, there is a 40% chance of a swing down over the next couple of weeks. That would extend the trading range.
Because the bull trend is so strong on the higher time frame charts, the chance of a strong breakout below the February low within the next few months is only 20%.
The bulls want a strong breakout above the wedge bull channel on the daily chart. More likely, too many traders see the rally from the February low as a bull leg in a trading range. Therefore, the odds are that there will be a bear leg lasting a couple weeks before there is a new high. The bears will probably need at least a micro double top before they can create a leg down.
Overnight Emini Globex trading
The Emini is down 8 points in the Globex session. Since yesterday was a buy climax, there is a 75% chance of at least 2 hours of sideways to down trading beginning by the end of the 2nd hour. But, yesterday’s rally was probably a buy vacuum test of the top of the wedge channel on the daily chart. Since that is resistance, there will probably be a pullback this week. That is more likely than a sustained breakout up to the all-time high.
If the bulls decide that they cannot get the month to close above the February open, some might give up. This means that they might take profits late today or tomorrow. If so, that could create a bear trend day.
Yesterday’s setups
Here are several reasonable stop entry setups from yesterday. I sometimes also show limit order entries and entries on the close of bars.
EURUSD should fall below last week’s low
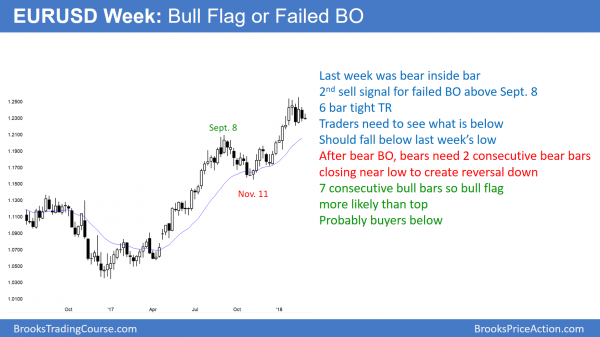
The EURUSD weekly Forex chart last week had a bear inside bar closing near its low. Hence, it is a sell signal bar for a failed breakout above the September 8 high. The 1st sell signal 4 weeks ago failed. After the 6 consecutive bull bars since December, this 6 week tight trading range is more likely a bull flag than a top.
The EURUSD weekly Forex chart has a 6 week bull flag. This means that the odds favor higher prices. However, the year long rally has had many big bull bars. Therefore, the rally contains a series of buy climaxes. That increases the chance of exhaustion. If the trend is exhausted, there could be a swing down to the November low. That is the most recent major higher low, and therefore support in a bull trend.
Trading ranges usually fall below support before reversing up. Last week’s low is support in the 6 week range. It is a good sell signal bar. In addition, it is reasonable for the bears to try to get a reversal down after a bull breakout. Therefore, the odds are that there will be a probe below last week’s low this week.
The bears want a reversal down. But, the bull trend is strong. Furthermore, this is not a major trend reversal pattern. Consequently, the odds are against a bear trend. If there is a successful bear breakout, it more likely will lead to a trading range. A logical bottom is the last major higher low, which is the November 7 low at around 1.1550. That is also about a measured move down from the 2 month trading range.
There will probably be buyers below last week’s low and then at least one more new high. Yet, the bull trend has a series of buy climaxes. The odds are that it will begin to enter a trading range soon. The range will probably be at least 500 pips tall and last several months.
Overnight EURUSD Forex trading
The EURUSD 5 minute Forex chart has been in a tight trading range for 5 days. The odds are that it will probe below last week’s low this week. That means the odds are against a strong rally until after a test below 1.2259. The bears hope that a break below last week’s low will be the start of a 300 pip selloff. They have a 40% chance of success. Day traders therefore have to be ready for a swing trade down.
There will be a break below last week’s low, and possibly below the February 1.2205 low, within 2 weeks. However, the yearlong bull trend has been strong and there is no strong top. The odds are that a bear breakout will reverse up. There will then probably be at least a 200 pip rally back up above the middle of the 6 week tight trading range.
Since the 5 day range is tight, day traders will continue to scalp until there is a breakout up or down. The breakout will probably come this week.
Summary of today’s S&P Emini futures price action and what to expect tomorrow
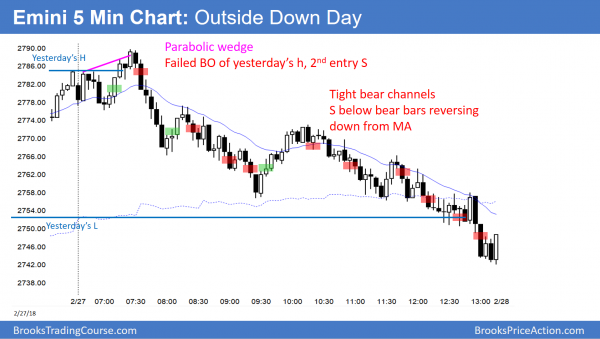
Today reversed down from above yesterday’s high to below its low. It was therefore an outside down day.
The Emini formed an outside down day today from a wedge lower high on the daily chart. Since the daily chart is probably in a trading range, there will probably be disappointing follow-through for the bears tomorrow, just as the bulls were disappointed today. Less likely, the Emini is resuming its bull trend or resuming its bear trend.
See the weekly update for a discussion of the price action on the weekly candlestick chart and for what to expect going into next week.
Traders can see the end of the day bar-by-bar price action report by signing up for free at BrooksPriceAction.com. I talk about the detailed S&P Emini futures price action real-time throughout the day in the BrooksPriceAction.com trading room. We offer a 2 day free trial.
When I mention time, it is USA Pacific Standard Time (the Emini day session opens at 6:30 am PST, and closes at 1:15 pm PST). You can read background information on the intraday market reports on the Intraday Market Update page.


Hi Al, I don’t understand some of the trades you showed today, can you pls explain? why would you short below bar 67?
On bar 67, price was near yesterday low and it’s at 60 min ema and prior lows did show some buying pressure (twice)
thanks
In general, when the Emini cannot hold above the EMA and it is in a tight bear channel, and a trader likes stop entries, it is best to sell below a bear bar after a reversal down. I agree with you that this bar was a the low of the day. But, it closed on its low, and the Emini did not become Always In Long above 64. It was reasonable to exit above 64. When that is the case, the Always In bears sell again below a bear bar closing on its low. Sometimes, they end up selling at the low.
thanks Al, got it!