Trading Update: Tuesday February 22, 2022
Emini pre-open market analysis
Emini daily chart
- On the daily Emini chart, Friday’s candlestick was a bear bar with a tail below closing slightly below February 14’s low.
- The bulls are hopeful they can get a strong stop entry buy setup for the Emini wedge bottom early next week, leading to a possible breakout of the February highs and a measured move up to the top of the January – February trading range.
- However, the bears ended up getting yesterday’s bar to close near its low, damaging the case for the Emini wedge bottom. Most bulls will probably want a micro double bottom before buying after 3 consecutive strong bear bars.
- While the bears are hopeful for a bear breakout of the January range, it looks like the bears are going to test the January low and probably go below it.
- The past 3 consecutive bear bars may lead to a 2nd leg trap, which would trap bears into selling too low. The bulls will need a strong bull signal bar before traders believe this will lead to a 2nd leg trap.
- As stated on several of the weekend reports, the market has consecutive OO patterns on the monthly chart, so the odds are that the market will fall below the January low before going above the January high.
- As stated above, the odds are that the market will not fall far below the January lows due to higher time frames being in a strong bull trend.
- It will be important to see what follow-through the bears get today. While the market is most likely always in short, the bears may need one more bar. Traders will wonder if this was a vacuum test of support (January 28 low).
- One thing to think about is that the market may still form an Emini wedge bottom here, and it is possible that February 14 started the count over and is now the first push. If the market gets a micro double bottom at around the January 28 low, it will act as a wedge bottom in a larger double bottom with the January low.
- Since the daily chart is likely still in a trading range, the odds are the bears will be disappointed today, reminding traders that the market is in a trading range.
Emini 5-minute chart and what to expect today
- Emini is up over 40 points in the overnight Globex session.
- The market went below the January 28 low and found buyers.
- The market is forming a credible wedge bottom on the daily chart.
- Since the market will gap up on the open, traders will be more open to a trend from the open bull trend day.
- If the market rallies with strong consecutive trend bars on the open, traders will look to trade in the direction of the trend.
- Most traders will want to see a pullback to the moving average before looking to buy.
- This means traders will likely want a double bottom or wedge bottom before looking to buy.
- Bears will look for a double top or wedge top before selling.
- Most traders will expect a limit order market on the open however a gap on the open always increases the odds of a trend day.
EURUSD Forex market trading strategies
EURUSD Forex daily chart

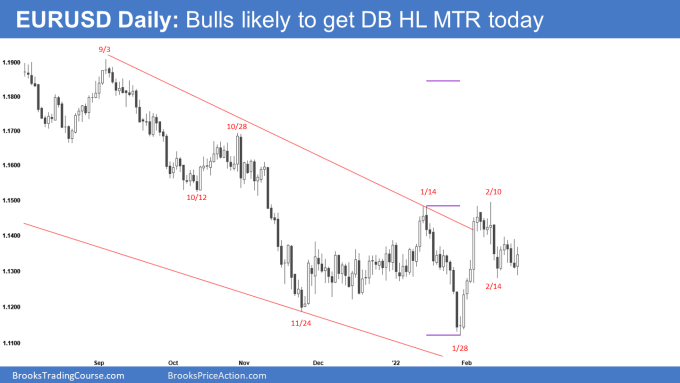
- The daily EURUSD Forex chart has a 7-bar tight trading range.
- The bulls tried for a higher low major trend reversal on February 15. However, the bulls failed, and the market continued more sideways.
- The bulls are forming a double bottom higher low major trend reversal (DB HL MTR) with the February 15 low. They will want a strong bull bar closing on its high to convince traders to buy. The 7-bar tight trading range lowers the probability.
- The odds still favor a rally that breaks above the February highs and a rally lasting for at least a couple of months (see weekly chart summary for details).
- The market has had a 12-bar pullback following the strong February bull breakout. The 12 bars lower the bulls’ probability; however, it is not yet 50%-50%, and the odds still favor more up.
- Since the market is still in a trading range, the market may fall below obvious support before reversing back up, such as the February 3 bottom of the bull breakout.
- Least likely, the market will have an endless pullback that sells off to the low of January.
- If the bulls are lucky today, they will close on their high.
- If today is a good buy setup for the DB HL MTR setup, bulls will buy above it. Other traders will wait for the market to get 2-3 consecutive bull bars before buying.
Summary of today’s S&P Emini futures price action and what to expect tomorrow

Al created the SP500 Emini chart.
End of day summary
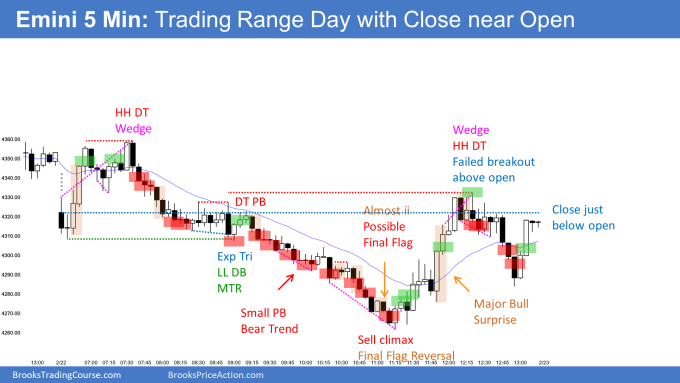
- The market tried to break below Friday’s low on the open and failed.
- The bulls got a strong bull breakout on bars 3-4; however, the breakout was inside Friday’s range which increased the odds of a failed bull breakout.
- At bar 12, most swing bulls got out of shorts, and the market tested Friday’s low again trying to form a lower low double bottom around bar 24. The bears ended up getting the bear breakout and almost got a measured move down.
- While the selloff went down for many bars in a tight channel, it was consecutive sell climaxes. When you get consecutive sell climaxes on a day where there has been a lot of trading range price action, it increases the odds that the day will try and close around the open, which it did.
See the weekly update for a discussion of the price action on the weekly chart and for what to expect going into next week.
Trading Room
Traders can see the end of the day bar-by-bar price action report by signing up for free at BrooksPriceAction.com. I talk about the detailed S&P Emini futures price action real-time throughout the day in the BrooksPriceAction.com on trading room days. We offer a 2 day free trial.
Charts use Pacific Time
When I mention time, it is USA Pacific Time. The Emini day session charts begin at 6:30 am PT and end at 1:15 pm PT which is 15 minutes after the NYSE closes. You can read background information on the market reports on the Market Update page.


It seems the bulls are defending 4300. I’m guessing the bears need a close below there to gain control.
‘As stated on several of the weekend reports, the market has consecutive OO patterns on the daily chart, so the odds are that the market will fall below the January low before going above the January high.’
this should be Monthly Chart ….
Ah yes thank you catching my mistake. I have updated it