Posted 7:15 a.m.
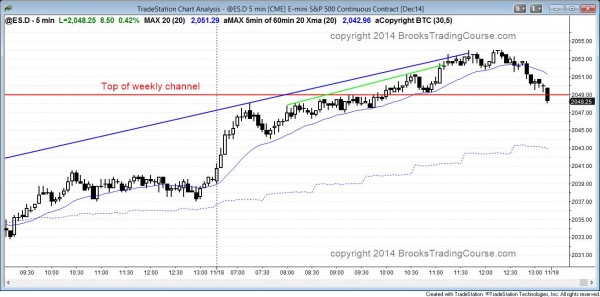
The Emini has a possible parabolic wedge top buy climax. It had a strong breakout to a new all-time high on the open and it is clearly always in long. However, a strong rally like this is usually followed by a trading range that lasts for hours and it often becomes the high of the day. I have many examples of parabolic wedge tops that created opening reversals, like June 16, June 24, July 17, and February 19. The probability for the bears is low until there is a strong bear breakout. If that happens, the Emini can quickly fall to the low of the day. If it gets there, it usually bounces for at least an hour or two.
The upside at this point is probably limited without first going sideways for hours. The risk of a reversal is probably 50%. The top of the weekly channel is just a little higher, around 2050, and the Emini might have to get there before it can reverse. This is a potential parabolic wedge top rally.
Here are my thoughts before the open. The tight trading range is continuing, but there will be a breakout at any point. Yesterday ended in always in long and there is a magnet above (the all-time high).
Day trading outlook for tomorrow’s Emini price action

The Emini had a trend from the open bull trend that became a spike and channel bull trend. It reversed down at the top of the weekly bull trend channel (pink horizontal line) and the top of two 5 minute channels.
The Emini broke out strongly to a new all-time high and it broke above the top of the weekly bull trend channel. However, that breakout was also a breakout above the top of two 5 minute bull trend channels. Bull breakouts above bull channels fail 75% of the time, and these breakouts failed late in the day. The Emini closed back just below the top of the weekly bull trend channel.
All higher time frame charts are overbought. However, they are also in strong bull trends and this makes a reversal more likely to lead to a trading range than a bear trend. This is especially true of the monthly chart. A trading range on the monthly chart could be 200 – 300 points tall, which would create a bear trend on the daily chart. The strength of the bull trend on the monthly chart will probably limit the downside for at least 4 – 6 months. The bears would need at least that many bars on the monthly chart to generate enough selling pressure before a bigger reversal had a reasonable chance of developing.
Going into tomorrow, the reversal down at the top of the weekly channel is good for the bears, but the weekly chart is up so strongly that it will probably have to go sideways for at least 3 weeks before a significant pullback will form.
The 60 minute chart is also extremely overbought and that makes a 20 – 50 point pullback increasingly likely. Although it might have begun at the end of today, the bears need follow-through selling. The bears hope that this rally today is an exhaustive buy climax and a failed breakout above a 6 day tight trading range. The bears want that trading range to be the final flag in the current 60 minute bull trend. Traders know that the 60 minute chart has gone up without a deep pullback for over a month. This makes it likely that it will have a pullback soon, and today’s buy climax might be the start. We will find out tomorrow if there is strong follow-through selling, or if this is just another reversal attempt that will become another bull flag and lead to another leg up.
Premarket price action analysis
See yesterday’s intraday market update report for today’s premarket analysis. Once there, scroll down to the heading, Day trading outlook for tomorrow’s Emini price action.
See the weekly update for a discussion of the weekly chart and for what to expect going into next week.
Traders can see the end of the day bar-by-bar price action report by signing up for free at BrooksPriceAction.com. I talk about the detailed Emini price action real-time throughout the day in the BrooksPriceAction.com trading room, and a 2 day free trial is available.
When I mention time, it is USA Pacific Standard Time (the Emini day session opens at 6:30 am PST, and closes at 1:15 pm PST). You can read background information on the intraday market reports on the Intraday Market Update page.

