Emini tight trading range failed bear breakout
Updated 6:44 a.m.
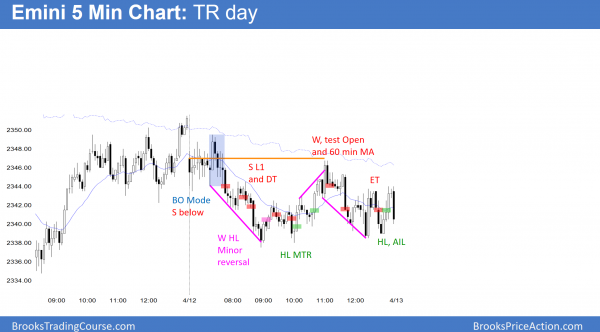
Today opened in the middle of yesterday’s 4 hour expanding triangle. The 1st bars had big tails. Limit order bulls and bears made money. These factors increase the chances that today will again have a lot of trading range trading.
Yesterday was a buy signal bar on the daily chart. The bulls therefore want to break above yesterday’s high, hoping for a swing up to the March 15 high. Yet, the daily chart is in a tight trading range. In addition, yesterday’s high is at the 60 minute moving average. These factors therefore reduce the chances that the bulls will get their big bull trend day.
While any day can break out, this early trading range trading increases the chances that today will be another trading range day. Traders are now deciding whether the 1st swing will be up or down. Because the Emini is in the middle of yesterday’s 4 hour range, today might go sideways for an hour or two before there is a breakout. The odds are against a strong trend day.
Pre-Open market analysis
While the Emini broke below the 6 day tight trading range yesterday, it formed another bull reversal. Furthermore, it is still within its 2 month trading range. Six of the last 8 days have been doji days. While the odds favor a rally to test last week’s high and maybe the March 16 major lower high, the Emini is probably in an early bear trend on the daily chart.
Yet, until there is a strong bear break below the March 27 higher low, traders will assume that the trading range will continue indefinitely. As a result, most days will be trading range days. Once there is a strong bear breakout, the Emini will probably for a measuring gap for a test below the weekly moving average, and a test of last year’s close.
Overnight Emini Globex trading
The Emini is down 4 points in the Globex session. Yet, yesterday is a buy signal bar on the daily chart. Traders are still deciding if the Emini will test the March 16 major lower high and then correct down 5%, or continue the correction that is already underway. Most of the days over the past 2 weeks were doji days. In addition, the Emini was been in a tight trading range for 3 weeks.
This is therefore a reflection of the decision traders are now making. Until there is a clear breakout, the odds favor that most days will continue to be trading range days.
EURUSD Forex market trading strategies
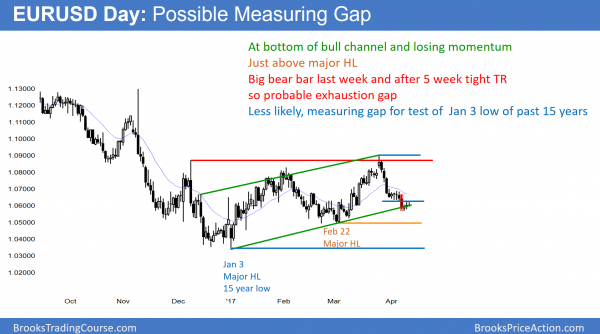
The gap on the EURUSD daily Forex chart above Tuesday’s high and last week’s tight trading range is still open. It therefore is still a measuring gap. Yet, the follow-through selling was weak. In addition, the chart is in a 6 month trading range and at the bottom of a bull channel.
While the momentum down 2 weeks ago was strong, it was weak last week and after Friday’s bear breakout. Since the daily chart is in the middle of a 6 month trading range, the odds are that the bears will be disappointed. Consequently, the gap below last week’s tight trading range will probably close. Hence, that gap will probably be an exhaustion gap. Furthermore, the bear rally will probably test the top of the tight trading range. Hence, the odds favor a 100 – 150 pip bear rally over the next few weeks.
Since there is still room down to the February 22 major higher low and it is a magnet, the EURUSD market might fall to 1.0500 before it rallies to last week’s high of around 1.0700. Yet, 80% of trading range breakout attempts fail. Therefore, the odds still are that this is still just a leg in the 6 month trading range.
Overnight EURUSD Forex trading
The EURUSD Forex market has been in a 10 pip range for the past 3 hours. Furthermore, it has been in a 30 pip range for 28 hours. It is in breakout mode. Until there is a breakout, day traders will continue to scalp.
If there is a strong reversal up that closes the gap, traders will swing trade for a test of last week’s tight trading range. If there is a bear breakout, traders will hold for a test of the 1.0500 February 22 higher low. Yet, the bulls will look for a reversal up from there.
Summary of today’s S&P Emini futures price action and what to expect tomorrow
The Emini had an inside day and a trading range day today. There were many limit order trades, in addition to the stop entries in the figure.
The Emini was in a trading range today. Therefore, day traders were buying below all prior lows and selling above all prior highs. Furthermore, they were entering on reversals as well. The daily chart is in breakout mode, but probably will test closer to the March 15 lower high before the swing down to the December close is clear.
See the weekly update for a discussion of the price action on the weekly candlestick chart and for what to expect going into next week.
Traders can see the end of the day bar-by-bar price action report by signing up for free at BrooksPriceAction.com. I talk about the detailed S&P Emini futures price action real-time throughout the day in the BrooksPriceAction.com trading room. We offer a 2 day free trial.
When I mention time, it is USA Pacific Standard Time (the Emini day session opens at 6:30 am PST, and closes at 1:15 pm PST). You can read background information on the intraday market reports on the Intraday Market Update page.


hi Al, why would you sell below low of the bear bar of the breakout mode? it looked like the price was at the bottom of the TR
thanks
I don’t know if you were in the chat room, but I talked about this. The bulls had a good reversal up and had their stops below that higher low. If the Emini fell below, the bulls would give up. Since they would give up and the range was likely to double (Breakout Mode), it was a reasonable short, even though it was at the bottom of the trading range. Traders were expecting a breakout and a measured move. That is the price where the bears would try now that the bulls failed.