Trading Update: Tuesday October 26, 2021
Emini pre-open market analysis
Emini daily chart
- Yesterday was a bull bar that broke to a new high. It is the 3rd consecutive bull bar closing above the September high (Friday’s close on the 5-minute chart was below the open, but it was above the open on the daily chart). The Emini strong breakout increases the chance of higher prices.
- The next resistance is the 4,600 Big Round number. Then, traders will look for a test of the top of the yearlong bull channel. That is currently around 4680.
- Above that is 4802.00, which is the measured move target, based on the height of the 4-month trading range.
- Any breakout can fail at any time. But the more bullish things that are present, the lower the probability of a reversal.
- Yesterday was the 8th consecutive bull bar on the daily chart. That is getting somewhat extreme, but there was a streak of 14 bull bars 3 years ago. Therefore, this streak could easily last all week.
- If there is a reversal down this week, it will be from a higher high double top. That would also be a higher high major trend reversal and an expanding triangle top, which I mentioned over the weekend.
- When a rally is strong, like this one has been, the bears typically need at least a micro double top before they can get a reversal down.
- Even if there is a reversal down, traders will buy the 1st 1- to 3-day selloff. With the Emini as overbought as it is on the 60-minute chart, there should be a pullback this week.
- The bears will need at least a couple big bear bars before traders will again begin to think about a possible bear trend reversal.
- Even then, until there are consecutive closes below major support, the odds will continue to favor higher prices.
- The best the bears can probably get over the next month is a move back to the middle of the July to October trading range.
- This is the final week of October. October is an outside up bar on the monthly chart, and September was an outside down bar. The more the month closes near its high, the more likely November will continue high.
- It is important to note that a bar often changes its appearance just before it closes. Therefore, there might be a selloff at the end of the week that puts a conspicuous tail on the top of this month’s candlestick. But even if it does, traders will expect at least slightly higher prices in November.
Emini 5-minute chart and what to expect today
- Emini is up 18 points in the overnight Globex session.
- It will gap up to a new all-time high.
- After 8 consecutive bull days, traders will try for another today. Therefore, there will be many traders looking to buy any selloff.
- The 60-minute chart has been in a tight bull channel since the streak of bull days began 9 days ago. That is extreme on the 60-minute chart, and it increases the chance of a sideways to down move today or tomorrow. But a sideways to down move for a few hours could still reverse up and close above the open.
- In a strong trend, more traders are looking to buy. That increases the chance of at least one swing up today.
- But with the Emini so overbought on the 60-minute chart, the odds of at least several hours down are increasing.
Yesterday’s Emini setups

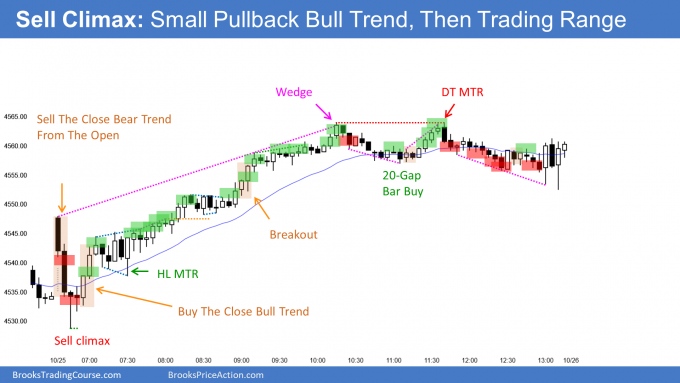
Here are several reasonable stop entry setups from yesterday. I show each buy entry with a green rectangle and each sell entry with a red rectangle. Buyers of both the Brooks Trading Course and Encyclopedia of Chart Patterns have access to a much more detailed explanation of the swing trades for each day (see Online Course/BTC Daily Setups).
My goal with these charts is to present an Always In perspective. If a trader was trying to be Always In or nearly Always In a position all day, and he was not currently in the market, these entries would be logical times for him to enter. These therefore are swing entries.
It is important to understand that most swing setups do not lead to swing trades. As soon as traders are disappointed, many exit. Those who exit prefer to get out with a small profit (scalp), but often have to exit with a small loss.
If the risk is too big for your account, you should wait for trades with less risk or trade an alternative market like the Micro Emini.
EURUSD Forex market trading strategies
EURUSD Forex daily chart

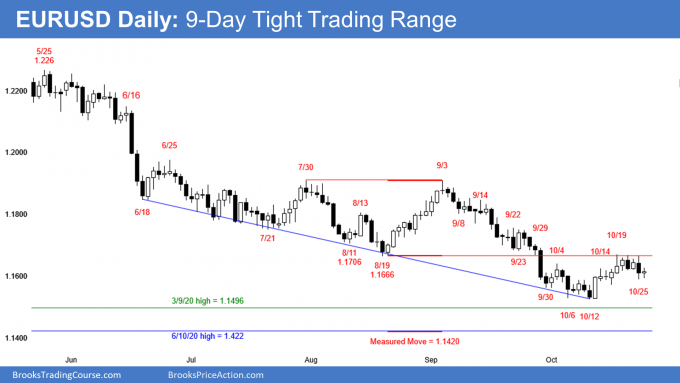
- Yesterday was an outside down day and it closed below Friday’s low, but in the middle third of the day’s range.
- Today so far is an inside day with a small range and a bull body. It is neutral.
- The EURUSD has been in a tight trading range for 9 days. That increases the chance of more sideways trading.
- The bulls hope it is a pause in a bull trend reversal that began on October 12. They want the October low to be the low for the remainder of the year.
- I have been saying that the 3-week rally more likely would be minor and should lead to a test of the October low. But the more days that go sideways, the more likely the bottom is in and that there will be a resumption up. A couple big bull days would make the reversal up a credible higher low major trend reversal.
- Currently, there is still a 50% chance of a test down to below the March 9, 2020 high within the next few weeks. That was the breakout point of last year’s strong rally. Since the EURUSD has been in a trading range for 7 years, traders should expect tests beyond support and resistance.
- That March 9, 2020 high is major support and the current price is near enough to make traders wonder if the selloff will have to get there before the bulls will attempt a test of the September 3 high.
- If the 7-month bear trend resumes this week, it will probably end around that March 2020 high or the June 10, 2020 high, which is the next lower breakout point.
- Traders should expect a reversal up that lasts at least several weeks. It should begin from around the October low or as far down as the June 10, 2020 high at around 1.14. That is also the measured move down from the July 30/September 3 double top.
Summary of today’s S&P Emini futures price action and what to expect tomorrow

End of day summary
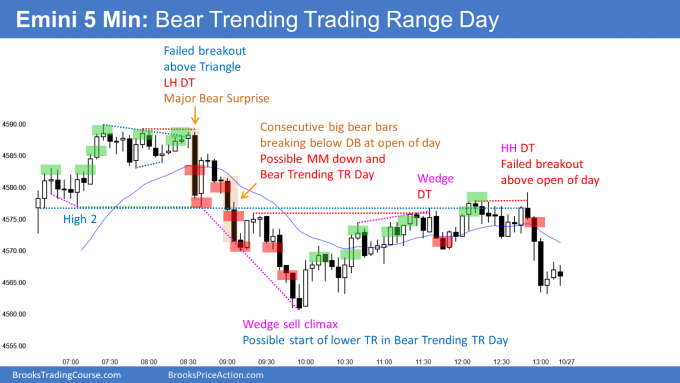
- After a weak rally on the open, the Emini entered a triangle.
- There was a Major Bear Surprise Bar and a selloff for about a measured move down to below yesterday’s high.
- The selloff was a parabolic wedge sell climax. The reversal was a Midday Bull Trend Reversal at Bar 41.
- The reversal up tested the open, but the reversal up failed.
- The bears got trend resumption down and the day closed near its low.
- Today was a bear day on the daily chart. It is a sell signal bar in a parabolic wedge buy climax.
- There is also an expanding triangle top that began with the July 26 high.
- But the 8 consecutive bull bars makes a 1- to 3-day minor reversal more likely than a bear trend.
- I have said a few times that there might be a pullback going into the end of the month.
- The bulls want the month to close above the September high. The bears want it to close below. Therefore, the September high might be a magnet for the remainder of the month, which ends on Friday.
See the weekly update for a discussion of the price action on the weekly chart and for what to expect going into next week.
Trading Room
Traders can see the end of the day bar-by-bar price action report by signing up for free at BrooksPriceAction.com. I talk about the detailed S&P Emini futures price action real-time throughout the day in the BrooksPriceAction.com trading room. We offer a 2 day free trial.
Charts use Pacific Time
When I mention time, it is USA Pacific Time. The Emini day session charts begin at 6:30 am PT and end at 1:15 pm PT which is 15 minutes after the NYSE closes. You can read background information on the market reports on the Market Update page.


Dr. Brooks, if I buy above 16, 22, and 23, am I expecting a bull trend continuation?
Or is 16 a credible High 2 buy but with bad follow through on a possible buy climax with a strong bearish response at Bar 15 means that the buys above 22 and 23 is used to scratch out all positions when price hits the descending triangle line?
Good question – I am interested in this, as well.
I bought the close of 10 expecting a MM based on the height of the two strong bull bars (9 & 10)… was stopped out by 25 (the Major Bear Surprise bar).
I bought 9H and the same, stopped out by 25… Expecting MM 1L 3H
I talked a lot about this in the chat room today. While there were consecutive bull bars closing near their highs, the follow-through was disappointing. The bulls were using the pushes up to exit longs instead of buying more. I bought the breakout but exited breakeven after the disappointing follow-through.
I said that the Small Pullback Bull Trend bulls needed at least one more breakout before traders would believe that the trend would continue. Instead, there was a triangle, which is Breakout Mode. I also said that I went short on the breakout below the triangle.
Remember, any strong move on the open has a 50% chance of reversing. The bulls got a 2nd leg sideways instead of up.
I like to exit when disappointed because I can always buy again if there is another buy signal. I did not want to buy above that big High 2 buy signal bar because it was buying at the top of a tight trading range exactly where disappointed bulls might exit. I said that I wanted to wait for another strong breakout before buying again, in case there was a bear breakout, which there was.
Woah.. seems like the chat room is a happening place to be in.. 🙂
Haven’t been there until now.. 😀