Trading Update: Tuesday March 8, 2022
Emini pre-open market analysis
Emini daily chart
- Emini had a strong bear breakout yesterday; closing below the January low. The bears are hopeful this will test the February 24 low and possibly break below.
- While the bears had a strong bear trend bar yesterday, look to the left, it’s a trading range which means the odds are the bears will be disappointed with the follow-through after yesterday’s selloff. This means that I think today will have a bull close.
- The bulls still see this setup as a higher low major trend reversal and are hopeful that this is a deep pullback; that will set up a reversal bull signal bar today or in the next few days.
- Bulls hope that the second leg up from the wedge bottom will rally and test the all-time high.
- Since the market is in a trading range, the Emini may fall below the February 24 low, making it the start of the wedge bottom January 24 (followed by February 24). Even if the market falls below February 24, the odds are the market will reverse back up.
- The bears were hopeful that yesterday was the start of the February 24 low test. They want a strong breakout below the February 24 low and a 4,000 big round number test. Next, they would like to try and get a crash to the pre-pandemic highs, but there is only around a 30% chance of that happening.
- The bears need to get follow-through today after yesterday and a strong push down to the February 24 low to make traders hesitant to buy the February 24 low.
- Right now, you have traders questioning if they should go ahead and buy before the market gets to the February low, just in case it never gets there.
- I bring the above up because although it is not likely, traders need to always be aware of the pain trade (course video 2C for reference). If today is a big bear bar (or a small doji and tomorrow is a big bear bar), it will increase the chances of bulls getting trapped. The pain trade here would be a strong bear breakout below the February 24 low, trapping bulls in and bears out.
Emini 5-minute chart and what to expect today
- Emini is up 8 points in the overnight Globex session.
- The Globex market has been in a trading range for the entire session.
- The bears had a second leg down during the overnight session, and the bulls had a strong reversal up during the early morning session of the Globex market.
- The bulls are currently trying to form a head and shoulders bottom, a higher low major trend reversal.
- The odds still favor today closing as a bull day on the daily chart.
- Traders will pay close attention to any selloff, and if they appear weak, they will look to fade.
- For a swing buy setup today, traders should look for a trend from the open or a double bottom, wedge bottom.
- Since yesterday was a strong bear trend day, traders should be aware that the market will probably have to go sideways in a trading range for at least 2 hours early on the open, which means a limit order market. Otherwise wait for a decent stop entry or a strong breakout with follow-through.
Yesterday’s Emini setups

Because I often get questions about what Daily Setups chart Encyclopedia members see, today I am including the example below of that version.

Al created the SP500 Emini charts.
Here are several reasonable stop entry setups from yesterday. I show each buy entry with a green rectangle and each sell entry with a red rectangle. Buyers of both the Brooks Trading Course and Encyclopedia of Chart Patterns have access to a much more detailed explanation of the swing trades for each day (see Online Course/BTC Daily Setups).
My goal with these charts is to present an Always In perspective. If a trader was trying to be Always In or nearly Always In a position all day, and he was not currently in the market, these entries would be logical times for him to enter. These therefore are swing entries.
It is important to understand that most swing setups do not lead to swing trades. As soon as traders are disappointed, many exit. Those who exit prefer to get out with a small profit (scalp), but often have to exit with a small loss.
If the risk is too big for your account, you should wait for trades with less risk or trade an alternative market like the Micro Emini.
EURUSD Forex market trading strategies
EURUSD Forex daily chart

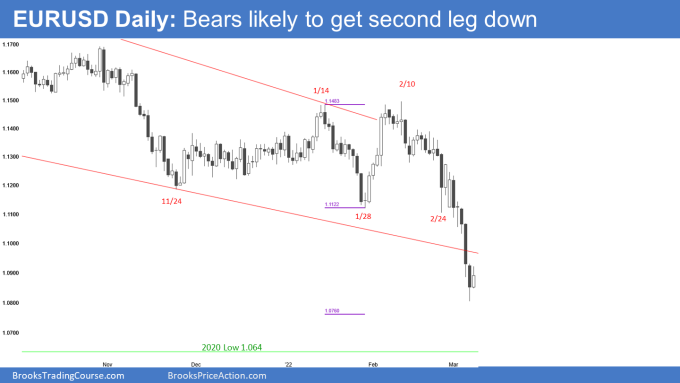
- The bears got a strong bear breakout below the bear channel last Friday and follow-through yesterday.
- Right now, the bears have an 11-bar bear microchannel.
- While the EURUSD will probably get a bounce here or in the next day or two, the bears will probably get a second leg down after any rally.
- The bears got a follow-through bar closing below its midpoint yesterday, which increases the odds that the bears will have to go lower or form a micro double bottom before bulls will be willing to buy for a swing.
- The bears also have a measured move target based on the 3-month TR and double top at 1.0760. Yesterday tested it within 40 pips, which means the market will probably have to get closer to the measured move target.
- The next target for the bears is the 2020 Lows around 1.0640. While the market probably will not get there, it is certainly possible that it does reach it.
- The bulls need to develop more buying pressure and need a strong breakout to the upside followed by a retest of this price level (which would be a major trend reversal) before there will likely be a credible swing.
- Today will probably have a bull close. The bulls need a strong bull bar to reverse yesterday’s follow-through bar. However, even if today closes on its high, any bounce will probably be minor and lead to sideways.
Summary of today’s S&P Emini futures price action and what to expect tomorrow

Al created the SP500 Emini charts.
End of day summary
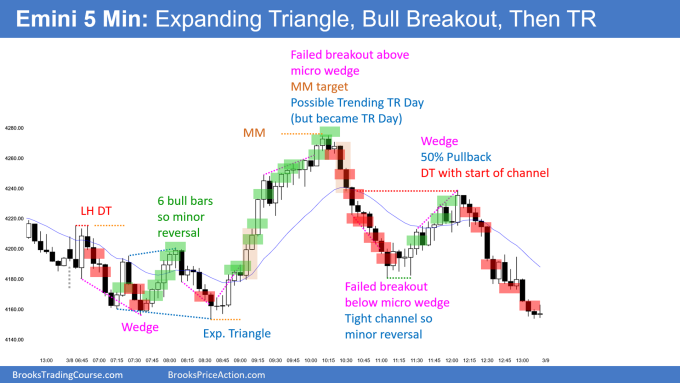
- Emini formed an Expanding Triangle around bar 24.
- The odds were the market would go sideways for two hours to relieve the consecutive sell climaxes yesterday.
- The first hour had a lot of solid bull bars, which significantly lowered the chances of the bears getting a bear trend day. This means traders would expect any selloff to test the bottom of a trading range and look to buy.
- The expanding triangle had strong bull closes, which increased the odds of an upside breakout. However, the probability was not high until bars 31 and 32.
- The breakout was strong up to bar 34, so the odds favored a second leg up—the second leg up to bar 44 led to a failed wedge top breakout and an endless pullback.
- The rally up to bar 44 led to consecutive buy climaxes, which increased the odds of sideways.
- Bar 48 made the market always in short, and the bears were likely to get a second leg down. The market was also likely to sell the close. However probably better to wait for bar 49.
- The selloff to bar 55 was strong; however, it is still in a trading range so that the bears may get a rally for a deep pullback.
- Bar 65 was a bull breakout of a wedge top, and the bulls failed on bar 67, which led to a test back to the low of the day and a sell the close finish.
- Today was a strong bull breakout that led to a trading range day. It is also a trendline break of the bear channel on the higher time frames and a retest of the lows (major trend reversal setup).
- It is important to measure the strength of the pullbacks during a strong move and be prepared to exit if one is long during bars 47-48. When bars 47-48 happened, bulls stepped aside and gave the bears a few legs before looking to buy again. The selloff to bar 55 was so strong that the rally up to bar 67 was likely due to bears stepping aside and bulls buying betting on a deep pullback from the bar 55 selloff.
See the weekly update for a discussion of the price action on the weekly chart and for what to expect going into next week.
Trading Room
Traders can see the end of the day bar-by-bar price action report by signing up for free at BrooksPriceAction.com. I talk about the detailed S&P Emini futures price action real-time throughout the day in the BrooksPriceAction.com on trading room days. We offer a 2 day free trial.
Charts use Pacific Time
When I mention time, it is USA Pacific Time. The Emini day session charts begin at 6:30 am PT and end at 1:15 pm PT which is 15 minutes after the NYSE closes. You can read background information on the market reports on the Market Update page.


Please would it be possible to put the bar numbers on the chart if they are going to be referenced extensively in the end-of-day summary?
How would you manage a trade if you’re long on the close of bar 48 – test of 20-EMA after almost 20 bars and especially bar 49 had a tail – double bottom with bar 36. How would you manage the trade? When ES makes new high or new low on the day and tests 20-EMA, it is a successful strategy to go short or long expecting either to retest low (if short) or retest high (if long) or at least to create higher low and lower high. Bar 48 thru bar 55 was an exception. Thus, if you’re trapped how would you manage this trade? I sold it around around bar 53 and then fortunately got long on bar 59 and exited on bar 68. Lost few points but was not comfortable in a long time…
If long on close of bar 48, most traders should exit since it is consecutive big bear bars, so prob Always in short. I would manage the trade by going to my long position at bar 48. (review video 51C for details).
“When ES makes new high or new low on the day and tests 20-EMA……” It depends on how strong the test to the moving average is and how strong your trend is. Here the test of the EMA was too strong, so there was too much risk of more down for most traders to stay long.
Thank you.