Trading Update: Friday February 9, 2024
S&P Emini pre-open market analysis
Emini daily chart
- The Emini formed a bull inside bar yesterday, following Wednesday’s bull trend bar. The daily chart is getting far from the moving average and will likely go sideways soon.
- The market will likely pull back soon and fall below the 5,0000 big round number.
- Because the daily chart is in a small pullback bull trend, the odds favor any selloff leading to a minor reversal, not a bear trend. This means that there are probably buyers below, scaling in lower.
- The bears need to develop more selling pressure in order to continue traders they have taken control. This means the bears must begin forming strong closes under the moving average. Without this, traders assume any pullback will be bought, leading to sideways trading.
- Overall, traders should expect the market to go sideways around the 5,000 big round number soon.
Emini 5-minute chart and what to expect today
- Emini is up 7 points in the overnight Globex session.
- The Globex market recently formed an upside breakout during the 8:30 AM EST report.
- The 8:30 AM Bul breakout is more likely to lead to exhaustion and sideways trading than the start of a bull trend day.
- Traders should assume that the U.S. Open will have a lot of trading range price action.
- As I often say, most traders should avoid trading during the day’s first 6-12 bars. This is because the open often has several failed breakout attempts, leading to a limit order open.
- It is common for the market to form a double top/bottom, or a wedge top/bottom before the opening swing begins.
- Most traders should wait for one of the above-mentioned patterns to form and attempt to catch the opening swing.
- The opening swing is important because it typically last for two legs and two hours and will often double the opening range. This leads to a great risk-reward trade with reasonable probability.
- Today is Friday, which means weekly support and resistance are important.
Yesterday’s Emini setups

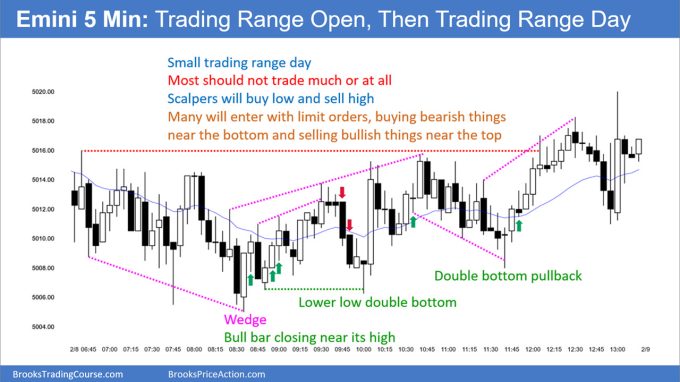
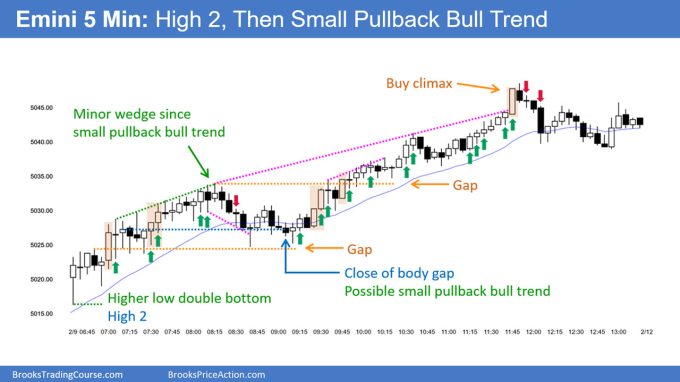
Al created the SP500 Emini charts.
Here are reasonable stop entry setups from yesterday. I show each buy entry bar with a green arrow and each sell entry bar with a red arrow. Buyers of both the Brooks Trading Course and Encyclopedia of Chart Patterns have access to a near 4-year library of more detailed explanations of swing trade setups (see Online Course/BTC Daily Setups). Encyclopedia members get current daily charts added to Encyclopedia.
My goal with these charts is to present an Always In perspective. If a trader was trying to be Always In or nearly Always In a position all day, and he was not currently in the market, these entries would be logical times for him to enter. These therefore are swing entries.
It is important to understand that most swing setups do not lead to swing trades. As soon as traders are disappointed, many exit. Those who exit prefer to get out with a small profit (scalp), but often have to exit with a small loss.
If the risk is too big for your account, you should wait for trades with less risk or trade an alternative market like the Micro Emini.
EURUSD Forex market trading strategies
EURUSD Forex daily chart
- The EURUSD formed a bull bar yesterday, which was a failed breakout below a Low 1 short.
- The bulls are hopeful that the past three days is the start of an endless pullback that will lead to a reversal up to the February 2nd high, which is the top of the most recent sell climax.
- The bears are hopeful that the current three-bar bull rally will become a bull leg in a trading range and lead to a second leg down below the February low.
- At the moment, the odds favor a test closer to the moving average.
Summary of today’s S&P Emini price action

Al created the SP500 Emini charts.
End of day video review
End Of Day Review will be presented in the Trading Room today. See below for details on how to sign up.
See the weekly update for a discussion of the price action on the weekly chart and for what to expect going into next week.
Trading Room
Al Brooks and other presenters talk about the detailed Emini price action real-time each day in the BrooksPriceAction.com trading room days. We offer a 2 day free trial.
Charts use Pacific Time
When times are mentioned, it is USA Pacific Time. The Emini day session charts begin at 6:30 am PT and end at 1:15 pm PT which is 15 minutes after the NYSE closes. You can read background information on the market reports on the Market Update page.


If an obvious important magnet like the All Time High gets tested during the globex, like it did last night, do most traders/institutions see that as an adequate test or does it usually need a test during the US sessions as well? I know the answer is probably not definite but just curious on people’s thoughts, thanks.