Emini and Forex Trading Update:
Thursday April 9
I will update again at the end of the day.
Pre-Open market analysis
The Emini yesterday formed a bull trend resumption day. It totally reversed Tuesday’s selloff. The next target is 2781, which the Emini reached right before the open. That is a 50% retracement of the 2 month bear trend.
However, the daily chart is in a trading range. The legs in a trading range usually go past support and resistance before reversing. Consequently, the odds still favor a little more to this rally before there is a pullback to the April 1 higher low.
If the bears get a reversal down in the next week, there would be a micro double top with Tuesday’s high. There would also be a wedge top, beginning with the March 19 high. The bears would then have a better chance of a 2 week test down to the April 1 higher low.
Overnight Emini Globex trading
After getting close to the 50% pullback level overnight, the Emini sold off. However, the selloff briefly dipped below 2706, which is 20% down from the high, and it reversed up sharply a few minutes ago to back above 2781.
The Emini rallied yesterday in a bull channel. Traders should view a bull channel as a bear flag because there is a 75% chance of a break below the channel. It can break below by going sideways or down. The chart then typically evolves into a trading range. That is what is likely today. With the rally as strong as it is, sideways is more likely than down. Also, the channel might continue up for another day or two before there is a breakout.
Today is the final trading day of the week. What the Emini does today affects the appearance of the weekly chart. This week so far is a big bull bar.
However, both 2781 and 2706.00 are very important prices. They could be magnets in the final hour.
Yesterday’s setups

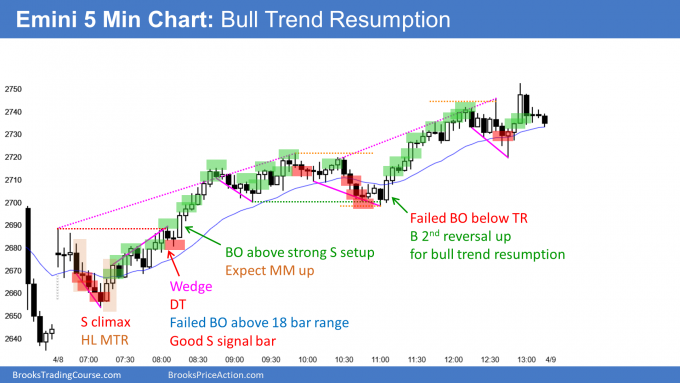
Here are several reasonable stop entry setups from yesterday. I show each buy entry with a green rectangle and each sell entry with a red rectangle. I rarely also show limit order entries and entries on the close of bars. Buyers of the Brooks Trading Course and Encyclopedia of Chart Patterns have access to a much more detailed explanation of the swing trades for each day (see Online Course/BTC Daily Setups).
My goal with these charts is to present an Always In perspective. If a trader was trying to be Always In or nearly Always In a position all day, and he was not currently in the market, these entries would be logical times for him to enter.
If the risk is too big for your account, you should wait for trades with less risk or trade an alternative market like the Micro Emini.
EURUSD Forex market trading strategies

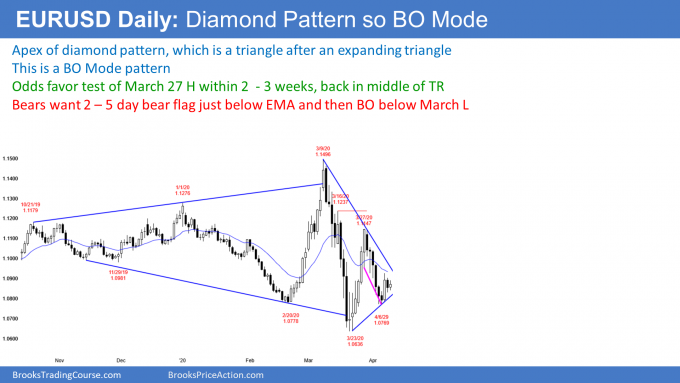
The daily chart of the EURUSD Forex market is at the apex of a triangle. The triangle follows an expanding triangle. This is a diamond pattern, which is a type of Breakout Mode pattern.
Since the EURUSD is closer to the bottom of the 7 month trading range, it is slightly more likely to break above the bull trend line and test the March 27 high. However, a chart would not have a Breakout Mode pattern if either the bulls or bears had a significant advantage. Traders think that the odds are about 50% for the bulls and bears. It is important to note that the 1st breakout in a Breakout Mode Pattern fails 50% of the time.
The EURUSD reversed up 2 days ago. Traders see yesterday as a pull back from that rally. They therefore expect at least a small 2nd leg up within a few days.
However, there is room to the bear trend line. Consequently, it is possible that the bulls can get a small 2nd leg up without breaking out of the diamond pattern.
The bears hope that the small 2nd leg up stalls at Tuesday’s high and the EMA. They then would want a reversal down from a micro double top at the EMA.
Overnight EURUSD Forex trading
The 5 minute chart of the EURUSD Forex market reversed down from just below yesterday’s high and up from just above yesterday’s low. Today so far is an inside day. Yesterday was also an inside day. Consecutive inside days on the daily chart is always some type of triangle on the 5 or to minute charts and it is a Breakout Mode pattern. It is nested within the Breakout Mode pattern on the daily chart.
The breakout can come at any time. When it does, it could be the start of a strong trend on up or down on all time frames.
However, until there is a breakout, there is no breakout. While waiting, day traders will continue to look for reversals to scalp for 10 – 20 pips.
Summary of today’s S&P Emini futures price action and what to expect tomorrow

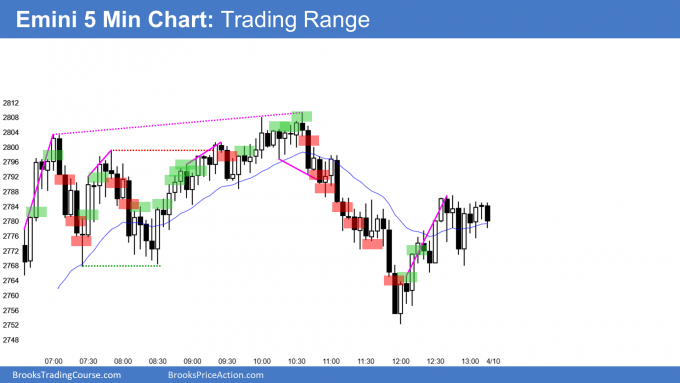
Here are several reasonable stop entry setups for today. I show each buy entry with a green rectangle and each sell entry with a red rectangle. I rarely also show limit order entries and entries on the close of bars. Buyers of the Brooks Trading Course and Encyclopedia of Chart Patterns have access to a much more detailed explanation of the swing trades for each day (see Online Course/BTC Daily Setups).
My goal with these charts is to present an Always In perspective. If a trader was trying to be Always In or nearly Always In a position all day, and he was not currently in the market, these entries would be logical times for him to enter.
If the risk is too big for your account, you should wait for trades with less risk or trade an alternative market like the Micro Emini.
End of day summary
The Emini opened with a big gap up. It quickly rallied to above 2781 and the 2800 Big Round Number. It then entered a triangle.
There was a weak rally to a new high, but then a reversal down from a wedge. The selloff ended in a sell climax at yesterday’s high.
Also, the day oscillated around 2781. The reversal up at the low was from almost exactly a measured move down from the high to 2781. It therefore remained the middle of the day.
There is a wedge on the daily chart. Today is the sell signal bar for Monday. But since it was a small doji bar, it is a weak sell signal bar.
See the weekly update for a discussion of the price action on the weekly chart and for what to expect going into next week.
Trading Room
Traders can see the end of the day bar-by-bar price action report by signing up for free at BrooksPriceAction.com. I talk about the detailed S&P Emini futures price action real-time throughout the day in the BrooksPriceAction.com trading room. We offer a 2 day free trial.
Charts use Pacific Standard Time
When I mention time, it is USA Pacific Standard Time (the Emini day session opens at 6:30 am PST, and closes at 1:15 pm PST). You can read background information on the intraday market reports on the Market Update page.


Hey Al,
Do you have any additional suggestions on scaling up position size I know it should be gradual but whenever I start increasing my position size I start getting more stressed an then if I take a loss on top of it I revert back to lower size. Of course as soon as I go back down to a lower size I make really good trades.
Traders have to trade the “I don’t care size” to be consistently profitable. There is no magic to increasing the size. It is trial and error, and it is perfectly fine to trade smaller than you want for a long time.
The key is to be consistently good. At some point, it will feel right to trade bigger.
There is a lot of emotion in the markets right now. This is not a good time to be increasing position sizes. Most traders should be trading smaller until the daily ranges get back to normal.
Thank you Al
Hi Al,
Thanks for your answer as I am also having similar answer like this. By the way, want to know how you would define daily range as normal?
Throughout most of 2019, it was around 15 – 20 points.