Trading Update: Friday October 13, 2023
S&P Emini pre-open market analysis
Emini daily chart
- The Emini pulled back yesterday due to the rally losing momentum. However, the rally that began last week is strong enough for a second leg up after the complex bottom on the daily chart.
- While the rally that began on October 6th was strong, it was within an overall trading range on the daily chart. This increases the risk of a deep pullback.
- Even though yesterday is a big bear bar, the odds favor a deep pullback and second leg up.
- It is essential to realize that the bears who sold the September 29th high and higher made money. This increases the odds of a trading range.
Emini 5-minute chart and what to expect today
- Emini is 13 points up in the overnight Globex session.
- The overnight Globex session sold off, testing near yesterday’s low. It formed a double bottom a few hours before the open of the U.S. Session and has rallied since.
- As always, Traders should assume that the open will have a lot of trading range price action. This means traders should think of an 80% chance of a trading range open and only a 20% chance of a trend from the open.
- This means that most traders should wait 6-12 bars before placing a trade unless they are comfortable trading with limit orders and making fast decisions.
- Most traders should try and catch the opening swing that often begins before the end of the second hour. It is common for the market to form a double top/bottom or a wedge top/bottom before the opening swing begins.
- Today is Friday, which means weekly support and resistance is essential. The bulls have a bull bar closing above its midpoint on the weekly chart. Bulls want today to form as big of a bull close as possible, and the bears want to create a big tail on the weekly chart.
- It is possible the midpoint (4367.5) of the week will be a magnet for the rest of the day.
- Since today is Friday, traders should be prepared for a possible surprise breakout up or down late as institutions decide on the week’s close.
Emini intraday market update
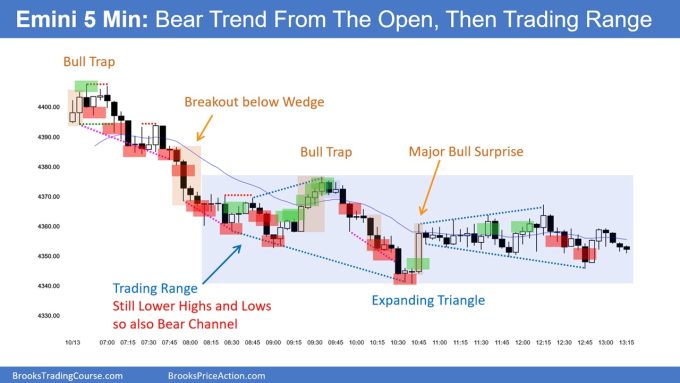
- The Emini gapped and rallied on the first two bars before forming a micro double top (bar 6), leading to a selloff.
- The bears have a bear breakout on bar 9, which is probably enough to make the market Always In Short and increase the odds of a second leg down. However, it is also a possible sell vacuum test of yesterday’s close. This means the bear breakout on bar 9 might be a trap, trapping bears into selling low in a trading range.
- As of bar 10, the bulls do not have a decent reversal bar to buy. This means that the bears still have the advantage of lower prices and a second leg down.
- Traders should be mindful that the selloff down to bar 11 has a lot of overlapping bars, which increases the odds of a trading range forming soon and the selloff not lasting all day.
- As of bar 15, the market is Always In Short and the bears want to get down to Yesterday’s low. Because of the buying pressure on the open and around bar 13, the odds favor sideways soon.
- The bulls need to develop more buying pressure if they are going to get a reversal. Until then, it is best to assume that any reversal up will be minor and lead to a trading range and not a strong reversal.
Yesterday’s Emini setups

Al created the SP500 Emini charts.
Here are reasonable stop entry setups from yesterday. I show each buy entry with a green rectangle and each sell entry with a red rectangle. Buyers of both the Brooks Trading Course and Encyclopedia of Chart Patterns have access to a near 4-year library of more detailed explanations of swing trade setups (see Online Course/BTC Daily Setups). Encyclopedia members get current daily charts added to Encyclopedia.
My goal with these charts is to present an Always In perspective. If a trader was trying to be Always In or nearly Always In a position all day, and he was not currently in the market, these entries would be logical times for him to enter. These therefore are swing entries.
It is important to understand that most swing setups do not lead to swing trades. As soon as traders are disappointed, many exit. Those who exit prefer to get out with a small profit (scalp), but often have to exit with a small loss.
If the risk is too big for your account, you should wait for trades with less risk or trade an alternative market like the Micro Emini.
EURUSD Forex market trading strategies
EURUSD Forex daily chart

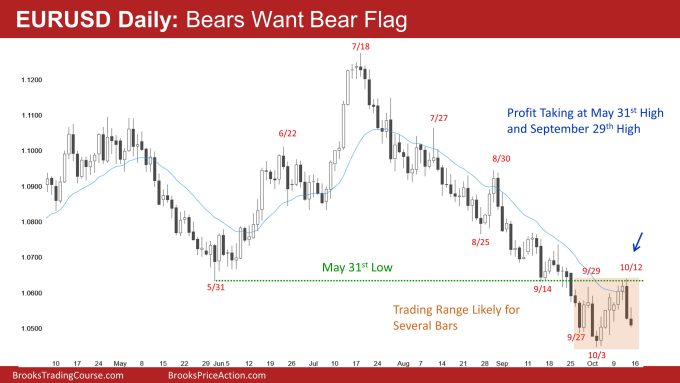
- The EURUSD sold off after testing the May 31st and September 29th low.
- The Bulls did a good job getting a reversal up over the past week. However, I mentioned that the market yesterday was barely Always In Long.
- The bulls needed 1-2 strong bull closes above the moving average before traders would be convinced that they had taken control.
- Traders knew that the bulls needed 1-2 more bars, and because of that, bears will sell, and bulls will begin to take partial profits, anticipating the buying pressure stalling.
- Yesterday was a strong enough surprise to make traders think a second leg down is likely.
- However, the selloff below yesterday’s low will probably lead to a trading range and not a measured move down of the past eight days.
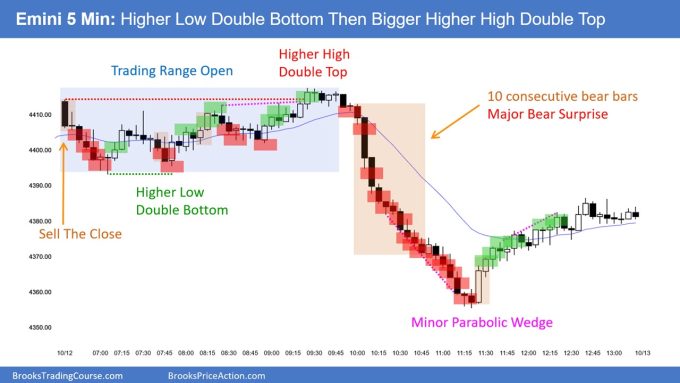
Summary of today’s S&P Emini price action


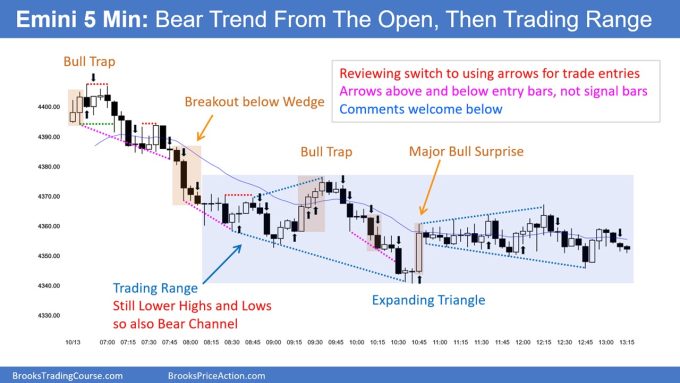
Above chart shows an alternative approach to marking up trade entries.
End of day video review
Video review to follow on YouTube. Stay tuned.
See the weekly update for a discussion of the price action on the weekly chart and for what to expect going into next week.
Trading Room
Al Brooks and other presenters talk about the detailed Emini price action real-time each day in the BrooksPriceAction.com trading room days. We offer a 2 day free trial.
Charts use Pacific Time
When times are mentioned, it is USA Pacific Time. The Emini day session charts begin at 6:30 am PT and end at 1:15 pm PT which is 15 minutes after the NYSE closes. You can read background information on the market reports on the Market Update page.


• To be consistent with BTC, would you be updating the lessons to change to arrows pointing to entry bars? It would appear to add confusion and be inconsistent if the lessons were not updated accordingly so that chart analysis in the lessons are consistent and conform to chart analysis in the daily and weekly reports.
• The BTC lessons also use arrows for instructional purposes (to point to a bar Al is instructing on) and that would appear could create additional confusion when reviewing the daily/weekly reports (maybe for new traders only?).
• What about buy/sell the close entries, which Al discusses throughout the lessons, where the signal bar is the entry bar? I like the current format of using the green / red boxes because if you want to indicate a close entry (on the signal bar), which some traders will take or the one tick above/below signal bar, which traders will take on the entry bar, both types of entries can be covered much better with the green / red box placed across the signal and entry bars. You’d have to use two arrows to accomplish what one box can illustrate and two arrows for two types of entries would cause more clutter / confusion, I would think.
• I’m a limit order trader so at first glance, my brain immediately went to, oh cool, you’re offering clairvoyant limit order arrows. Kind of confusing at first but I get it now, the report rules haven’t changed, always stop entries.
I’m a proponent of train the way you fight so if you will change to arrows on the reports, it seems reasonable to train us that way in BTC but I prefer the green/red boxes for the reasons provided. And dare I say, what about the voluminous Encyclopedia? Obviously rhetorical questions I would think (on BTC and The Encyclopedia); maybe it provides clarity on whether to use the new arrows or not?
P.S. (Suggestion to improve report flow)
You have the stop entry and chart legend details in the report section: Yesterdays Emini Setups but not in the end of day summary section (maybe once is good enough). But consider moving Al’s italicized, small font (but very important) details into larger, regular font and retitle the last section on Chart uses Pacific time to something like “Chart Legend & Trading Principles” (there’s probably a better title) and put chart legend info, explanation of green and red boxes, Al’s trading principles, and cross references, etc., into one section. I can offer a consolidated example if interested.
Thank you for soliciting feedback from time-to-time. And thanks to the analysts who write the daily and weekly reports. Always much appreciated.
Dear Al,
First things first, the trading community genuinely appreciates and admires your contribution. Impressive!!! Million thx!
Regarding the arrows vs colored boxes, I definitely prefer the colored boxes. It is much more visual in defining the exact entry point and why. Colored boxes are more intuitive and clean.
The arrows seem to add an additional thinking step, making it more complicated to make sense of the entry.
Hope this helps.
Regards,
Mario
I definitely prefer the colored boxes. Makes exact place of entry much clearer. Also long or short is more obvious in color, especially when not in full screen.
I prefer the colored boxes to be honest but I think that it would be much better to have the arrows being either green or red as K L suggests.
Can we have the arrows with the same green/red colors?
I think this is a very good suggestion. It would remove the concern that colored box advocates have with not being able to see if it is a long or short setup. Colored arrows would be great. This is how I mark my EOD chart as well.
I think the arrows make the chart much more readable. Good idea.