Trading Update: Thursday March 10, 2022
Emini pre-open market analysis
Emini daily chart
- Yesterday saw the Emini rally back to middle of prior bear leg.
- The market is still deciding if March 8 was enough of a test of the February 24 low or if the market has to get closer to it.
- While yesterday gapped up, and that is a sign of strength, it is still forcing traders to buy above a bear bar (March 8) which in general is not a great buy.
- Currently, the market has a wedge bottom and is trying to form a higher low major trend reversal.
- The bulls hope they can get a bull breakout here and a rally that breaks above the March 3 high and eventually tests the All-time High.
- The bears want a strong breakout below the February 24 low.
- More likely, the market will continue to go sideways in a trading range as the market decides which side will get a strong breakout with follow-through.
Emini 5-minute chart and what to expect today
- Emini is down 50 points in the overnight Globex session.
- The market had a bear breakout of a tight trading range that led to a bear channel for about 5 hours during the Globex session.
- Bear channels should be considered bull flags, and one should expect an upside bull breakout today.
- Traders should expect a trading range open this morning, and assuming the market opens with a big gap, traders should expect a test of the moving average similar to what I said yesterday.
- If the market opens below yesterday’s low, that will trigger an L1 short, which will probably have buyers below.
- Overall, traders should expect a limit order market and wait for a credible stop entry or a strong breakout with follow-through.
Yesterday’s Emini setups

Al created the SP500 Emini charts.
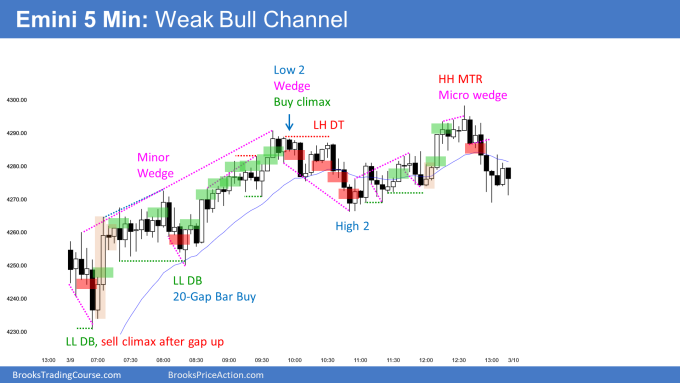
Here are several reasonable stop entry setups from yesterday. I show each buy entry with a green rectangle and each sell entry with a red rectangle. Buyers of both the Brooks Trading Course and Encyclopedia of Chart Patterns have access to a much more detailed explanation of the swing trades for each day (see Online Course/BTC Daily Setups).
My goal with these charts is to present an Always In perspective. If a trader was trying to be Always In or nearly Always In a position all day, and he was not currently in the market, these entries would be logical times for him to enter. These therefore are swing entries.
It is important to understand that most swing setups do not lead to swing trades. As soon as traders are disappointed, many exit. Those who exit prefer to get out with a small profit (scalp), but often have to exit with a small loss.
If the risk is too big for your account, you should wait for trades with less risk or trade an alternative market like the Micro Emini.
EURUSD Forex market trading strategies
EURUSD Forex daily chart

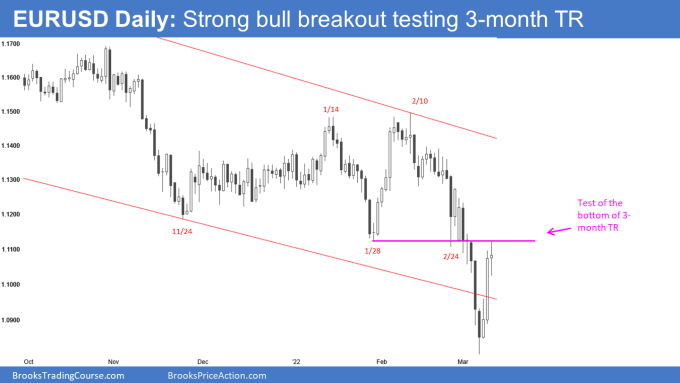
- The bulls closed yesterday with a big bull bar closed above March 4.
- This means the bears are giving up and agreeing that last week’s bear breakout below the bear channel will likely be a failed bear breakout.
- Yesterday was strong enough to lead to a second leg up and a test of the 3-month trading range low.
- There are scale-in bulls who bought the 3-month trading range bear breakout around March 1. Those bulls are now deciding if they are going to exit back at their original entry, which is around the low of the 3-month trading range, or if they should stay long betting on a test of the February highs.
- The odds were that the 3-month trading range would be a final flag. Back in late January, it looked like the final flag setup was a bear breakout and reversal up in early February. The trading range expanded, and now the market is getting the same setup.
- The bulls hope the rally will be similar to the February 3 bull breakout (4 consecutive bull bars).
- While the market is probably always-in long and strong enough for a second leg up, traders will pay close attention to today. Will today be a strong bull trend bar, showing further conviction by the bulls and increasing the odds of more up, or will today be a doji or bear bar showing hesitation?
- Although the EURUSD is likely going higher, there is a possibility that there could be a 50% pullback of the 2-day rally, so traders buying here have to be aware of the potential for a deeper pullback than the bulls would want.
- While this is a strong reversal and most bears should probably exit, traders do not know if this is the start of the rally that reaches the February high or will be a rally that leads to more sideways.
- Lastly, the odds are the market will test the top of the bear channel, and it could do so by getting more of a strong rally or by going sideways.
Summary of today’s S&P Emini futures price action and what to expect tomorrow

Al created the SP500 Emini charts.
End of day summary
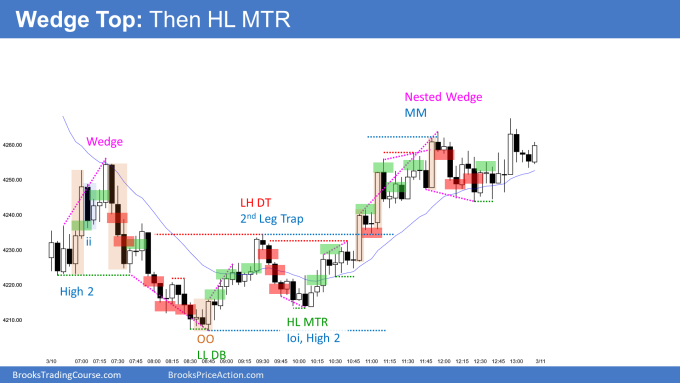
- The bulls traded sideways for the first 4 bars following a large gap down, which increased the odds of more sideways to up trading and a test of the moving average.
- The bull rally lead to a wedge top at the moving average that led to a spike and channel, which was the low of the day.
- The channel down was tight, so the first reversal above the moving average was likely minor and followed a higher low major trend reversal. Which is what the bulls got around 10:10 (PST time)
- This higher low significant trend reversal led to swing trade and sideways into the close.
- Overall, the day was mostly a trading range day with large swings.
- It is important to pay close attention to the number of legs during a swing within a trading range because they will often form 2nd leg traps and wedges that reverse.
See the weekly update for a discussion of the price action on the weekly chart and for what to expect going into next week.
Trading Room
Traders can see the end of the day bar-by-bar price action report by signing up for free at BrooksPriceAction.com. I talk about the detailed S&P Emini futures price action real-time throughout the day in the BrooksPriceAction.com on trading room days. We offer a 2 day free trial.
Charts use Pacific Time
When I mention time, it is USA Pacific Time. The Emini day session charts begin at 6:30 am PT and end at 1:15 pm PT which is 15 minutes after the NYSE closes. You can read background information on the market reports on the Market Update page.


Thanks Brad for the great report as always! 2nd paragraph I assume you meant to say bears got wedge top and not bulls right?
Is it just me or does it seem like there are more outside days than usual lately?
I wasn’t aware of these analysis earlier: just started reading them since last 2 days, It has kept me out of chop and helped navigate the market with a clear head.
Thanks Very much!
Absolutely great analysis. Helped me stay off the market in the beginning hour(s). Thankyou!