Trading Update: Monday November 27, 2023
S&P Emini pre-open market analysis
Emini daily chart
- The daily chart of the Emini is in a tight bull channel and testing near the September 1st top of the bear channel. While the market will likely reach the September 1st high, the market may have to pull back to the moving average first.
- The odds favor the market reaching the September 1st high at 4,597. The next target for the bulls is the July 27 high, which is the top of the bear breakout.
- It is important to realize that the daily chart is in a trading range, and the odds favor sideways trading over the next several months.
- The market is far from the moving average and may have to get closer to it before bulls are willing to buy.
- The Emini might sell off to the moving average or go sideways until the moving average catches up to the current price level.
- Traders are happy to buy far from the moving average if they can justify buying high if the market is trending. However, most bulls do not want to buy high at an expensive price when the market is in a trading range, especially when the market is far from the moving average.
- Overall, the Emini may have to pull back and get closer to the moving average before bulls are willing to buy. This means traders should expect a pullback lasting a few days for the market to get closer to the moving average.
Emini 5-minute chart and what to expect today
- Emini is down 8 points in the overnight Globex session.
- The Emini has gone sideways for most of the overnight session. This increases the odds of sideways trading on the open.
- Because the daily chart is overbought, this increases the odds that today may close below the day’s open, creating a bear bar on the daily chart.
- Traders should pay attention to the open of the day and the prior trading day’s low, as both will likely be magnets during today’s U.S. Session.
- Traders should consider not trading during the first 6-12 bars on the open unless they can make quick decisions. This is because most breakouts during the open fail and lead to sideways trading.
- By waiting for 6-12 bars, a trader gains clarity on the type of day the Emini is forming.
- Most traders should try to catch the opening swing that often begins before the end of the second hour.
- It is common for the market to form a double top/bottom or a wedge top/bottom that leads to the opening swing. A trader can often wait for one of the abovementioned patterns to form before placing a swing trade.
- The most important thing to remember is that a trade is never overdue. If a trader is uncertain about what to do, waiting is often better.
Emini intraday market update
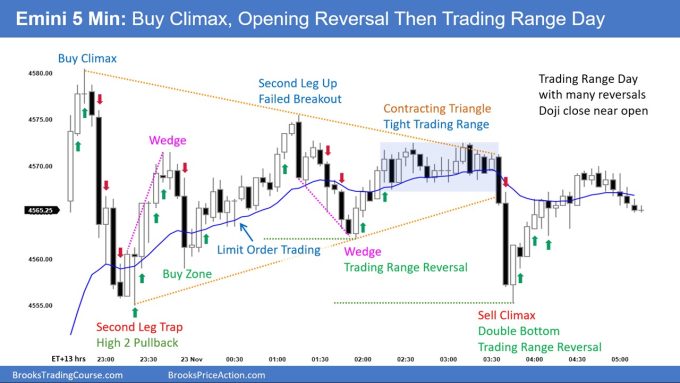
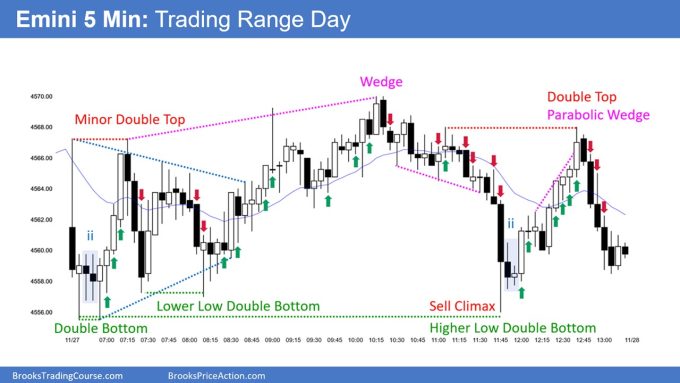
- The Emini is continuing to go sideways in a large triangle over the past few trading days. The market is in breakout mode and deciding on the direction of the breakout.
- As of bar 36, the market has yet to achieve the successful breakout of today’s range.
- It is important to be patient and waiting for a clear breakout with follow-through is important. Trading ranges often have breakouts that trap traders into betting the breakout will succeed, only to get trapped into a losing trade.
Pre-Thanksgiving Emini setups

Richard created the SP500 Emini chart (Al on Thanksgiving leave).
Here are reasonable stop entry setups from Wednesday before Thanksgiving break. I show each buy entry bar with a green arrow and each sell entry bar with a red arrow. Buyers of both the Brooks Trading Course and Encyclopedia of Chart Patterns have access to a near 4-year library of more detailed explanations of swing trade setups (see Online Course/BTC Daily Setups). Encyclopedia members get current daily charts added to Encyclopedia.
My goal with these charts is to present an Always In perspective. If a trader was trying to be Always In or nearly Always In a position all day, and he was not currently in the market, these entries would be logical times for him to enter. These therefore are swing entries.
It is important to understand that most swing setups do not lead to swing trades. As soon as traders are disappointed, many exit. Those who exit prefer to get out with a small profit (scalp), but often have to exit with a small loss.
If the risk is too big for your account, you should wait for trades with less risk or trade an alternative market like the Micro Emini.
EURUSD Forex market trading strategies
EURUSD Forex daily chart
- The EURUSD is continuing to rally in a bull channel, following the November 14th bull breakout.
- While the market is Always In Long, and likely to go higher, the market is far away from the 20-period moving average. This increases the risk of a deep pullback before the market continues higher.
- Overall, traders should expect the EURUSD to begin to go sideways and test closer to the moving average.
Summary of today’s S&P Emini price action

Al created the SP500 Emini chart.
End of day video review
See the weekly update for a discussion of the price action on the weekly chart and for what to expect going into next week.
Trading Room
Al Brooks and other presenters talk about the detailed Emini price action real-time each day in the BrooksPriceAction.com trading room days. We offer a 2 day free trial.
Charts use Pacific Time
When times are mentioned, it is USA Pacific Time. The Emini day session charts begin at 6:30 am PT and end at 1:15 pm PT which is 15 minutes after the NYSE closes. You can read background information on the market reports on the Market Update page.


Bar 21 looks like a long entry bar after the bar 20 significant reversal up from a triple bottom.
I guess Al decided against treating the bear bar as signal bar, especially with tail on top. But sometimes he will, as others would, given the context and clear buying pressure and double bottom here. The second entry is safer and more likely given probably managing a short trade during bar 20.