Emini October earnings reports, but buy climax increases risk
Updated 6:45 a.m.
Today began with a small doji in the middle of yesterday’s range. This reduced the odds of a big trend day and it increases the odds that today will be another mostly trading range day. Additionally, it increases the chances for a trading range open. This means that the Emini might go mostly sideways in a limit order market for an hour or two before it decides on the direction of the 1st swing.
While any day can become a strong trend day at any time, in the absence of consecutive big trend bars, the odds favor an 8th consecutive trading range day.
Pre-Open market analysis
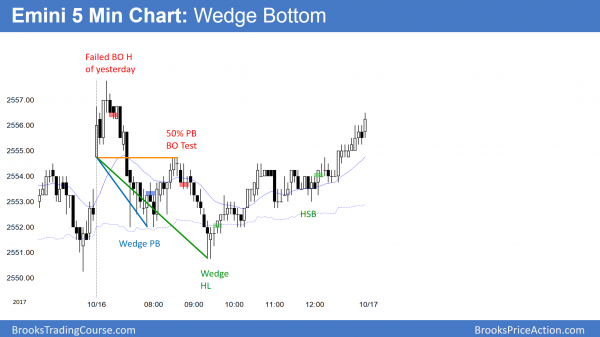
The Emini again yesterday sold off on the open from a new all-time high. Yet, there is still an obvious measured move target on the daily chart that is just 7 ticks above yesterday’s high. The odds are that the Emini will reach it. However, because the past 7 days have been mostly sideways, the odds favor a mostly sideways day again today.
There is a 7 day wedge top after a buy climax on the daily chart, In addition, there are sell climaxes on the weekly and monthly charts. Therefore this small wedge top has a better chance of leading to a major reversal on the daily chart. The odds favor the start of a 100+ point pullback within the next few weeks. This therefore increases the odds of one or more big bear bars.
In addition, since a selloff is likely, traders have to consider the opposite. Whenever something is likely, the opposite becomes more likely. Therefore, there is also an increased chance of a brief strong bull breakout as well over the next couple weeks.
Overnight Emini Globex trading
The Emini is down 1 point in the Globex session. The day session got to within 2 points of a major measured move target yesterday. The bulls will try to get to that target again this week. However, because the weekly and monthly charts are historically overbought, there is a higher probability of a strong reversal down from this level. Furthermore, if there is a strong selloff, the odds would begin to shift in favor of a 1 – 3 month pullback.
Until there is a reversal, there is no reversal. The past 7 days have been small and mostly sideways. Since markets have inertia, it makes another small and sideways day likely again today. However, there have been several days over that past 2 weeks where there was strong early selling. Since a big bear day is becoming increasingly likely, traders should expect that one of these early selloffs will lead to a big bear day and not another trading range day.
Yesterday’s setups
Here are several reasonable stop entry setups from yesterday. I sometimes also show limit order entries and entries on the close of bars.
EURUSD Forex market trading strategies
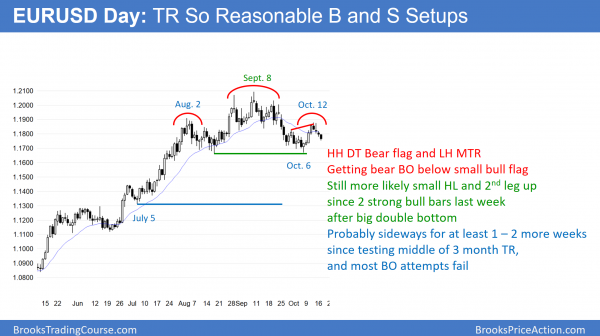
The daily EURUSD Forex chart has been in a trading range for 3 months. It therefore has both a reasonable buy setup and a reasonable sell setup. The bulls rallied from a double bottom and a small wedge bottom and are likely to get a small 2nd leg sideways to up. The bears overnight broke below a 3 day bull flag. They want a strong break below the big double bottom because that would trigger a head and shoulders top sell signal.
The daily EURUSD Forex chart broke below a 3 day bull flag overnight. While good for the bears, the odds still favor at least a small leg sideways to up. However, if the bears get a strong break below the bottom of the 3 month range, it would trigger the head and shoulders top. The odds would then favor a measured move down to around the July 5 low. Since most trading range breakouts fail, the odds still favor a continuation of the trading range.
Furthermore, patterns usually have fairly good symmetry. If last week’s high ends up as the right shoulder of the 3 month trading range top, the symmetry would not be good. The right shoulder began with last week’s low. This means that it has lasted only 2 weeks. The left shoulder and the head each lasted a month or more. This reduces the chances that the right shoulder is complete. Finally, the bears need a strong breakout and strong follow-through selling before traders will conclude that the daily chart has converted into a bear trend.
The bulls are disappoint by last night’s selloff. Yet, the small wedge bottom from 2 weeks ago and the big double bottom is still in effect. The odds therefore still favor at least a small 2nd leg sideways to up after last week’s strong 2 day rally after the buy signal.
Weekly 20 Gap Bar buy signal
The weekly chart has sold off in a tight channel for 7 weeks. It therefore will probably need at least a micro double bottom. This means that this selloff will probably test the October 6 low at some point in the next few weeks. That would also create a 20 Gap Bar buy signal. The bulls have been buying above the 20 week exponential moving average for more than 20 weeks. This means that there is a gap below the low off every bar and the moving average. Once they probably get a chance to buy at an average price, they will probably will take it. This reduces the chances of a big selloff over the next several weeks.
Overnight EURUSD Forex trading
While the 5 minute chart sold off in the Asian session, it has been in a 25 pip range for the past 7 hours. The trading range is a triangle, and it is in a 4 day bear trend. The odds therefore favor at least a small bear breakout. Yet, since the daily chart still is likely to have at least a small 2nd leg up from this 4 day selloff, bulls will watch for a reversal up within the next 2 weeks.
Summary of today’s S&P Emini futures price action and what to expect tomorrow
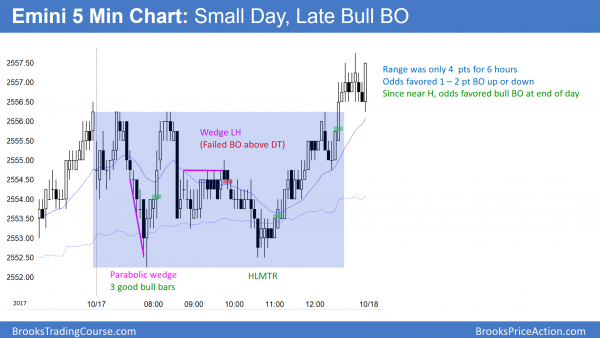
Today was a small day, and the 8th day in a tight wedge bull channel. It had a small bull breakout at the end of the day.
The Emini’s high yesterday was within 7 ticks of a major measured move target on the daily chart (see the weekend update). The odds still favor a test of that resistance. However, because the weekly and monthly charts are historically overbought, the odds favor a 1 – 3 month correction starting within a few weeks, and possibly this week. The 8 day wedge top might lead to a major reversal on the daily chart. However, any selloff will probably last only 1 – 3 months and become a bull flag on the weekly and monthly charts.
See the weekly update for a discussion of the price action on the weekly candlestick chart and for what to expect going into next week.
Traders can see the end of the day bar-by-bar price action report by signing up for free at BrooksPriceAction.com. I talk about the detailed S&P Emini futures price action real-time throughout the day in the BrooksPriceAction.com trading room. We offer a 2 day free trial.
When I mention time, it is USA Pacific Standard Time (the Emini day session opens at 6:30 am PST, and closes at 1:15 pm PST). You can read background information on the intraday market reports on the Intraday Market Update page.


