Trading Update: Thursday May 25, 2023
S&P Emini pre-open market analysis
Emini daily chart
- The Emini gapped down yesterday and reversed up after testing the May 16th low and the apex of the month-long triangle.
- Emini likely bounce over the next day or two as traders take profits. However, the selloff was strong enough that a 2nd leg down is likely, even if there is a deep pullback first.
- The bulls who bought the close of May 17th or the low two bars later are disappointed and trapped. They will likely use any bounce to exit their losing trade with a smaller loss or break even if they scale in lower.
- The bears know the bulls are trapped. They will sell any rally expecting the bulls to exit longs.
- There are bears who sold the May 4th high and got trapped on the May 5th breakout. Those bears never could exit their losing trade back at the May 4th high. This means the market will probably reach the May 4th high and allow the trapped bears out of their trade.
- Overall, the bears expect a 2nd leg down after the recent four-bar selloff from the May 19th high. The bears will try to break below the May 4th low and reach the 4,000 considerable round number. However, if they are going to reach 4,000 they need to show more signs of strength.
Emini 5-minute chart and what to expect today
- Emini is up 30 points in the overnight Globex session.
- The Globex went sideways for most of the overnight until rallying late in session.
- On the 60-minute Globex chart, the bulls have broken above the bear trendline (May 23rd – May 24th). Next, the bulls want to form a major trend reversal. However, they will probably need to test the low of the Globex session 4,1355.5 before they have a credible high-low major trend reversal.
- The bears want a large double-top bear flag and trend resumption down.
- Traders should assume the U.S. Session will have a lot of trading range trading.
- As I often say, most traders should wait for 6-12 bars before placing a trade unless they are comfortable with limit order trading.
- Most traders should focus on catching the opening swing that often begins before the end of the second hour.
- The opening swing often occurs after the formation of a double top/bottom or a wedge top/bottom. This allows a trader to enter on a strop entry and allows a trader great risk/reward on a reasonable swing trade.
- The most important thing to remember is to be open to anything happening and never deny what is happening on the chart.
Emini intraday market update
- The Emini sold off on the first two bear bars making the odds favor a trading range or a bear trend day.
- The bulls were able to disappoint the bears and create decent buying pressure, which increased the odds of the market going sideways.
- Because of the trading range price action over the first 40 bars, traders should assume the day will remain in a trading range.
- The market has not broken out of the 18-bar range. This means the odds favor a breakout of the bar 1 high or 11 low.
- Traders should assume that every breakout above and below the range will fail; until there is a clear breakout, there is no breakout.
- The market may be forming a triangle, and we could get a late breakout of the 18 bar range, similar to what happened on May 22nd.
Yesterday’s Emini setups

Al created the SP500 Emini charts.
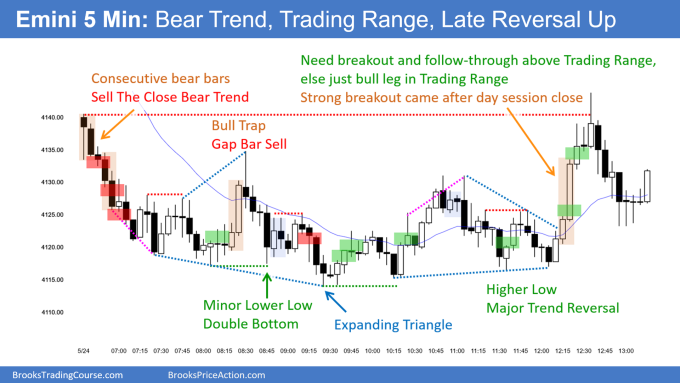
Here are several reasonable stop entry setups from yesterday. I show each buy entry with a green rectangle and each sell entry with a red rectangle. Buyers of both the Brooks Trading Course and Encyclopedia of Chart Patterns have access to a near 4-year library of more detailed explanations of swing trade setups (see Online Course/BTC Daily Setups). Encyclopedia members get current daily charts added to Encyclopedia.
My goal with these charts is to present an Always In perspective. If a trader was trying to be Always In or nearly Always In a position all day, and he was not currently in the market, these entries would be logical times for him to enter. These therefore are swing entries.
It is important to understand that most swing setups do not lead to swing trades. As soon as traders are disappointed, many exit. Those who exit prefer to get out with a small profit (scalp), but often have to exit with a small loss.
If the risk is too big for your account, you should wait for trades with less risk or trade an alternative market like the Micro Emini.
EURUSD Forex market trading strategies
EURUSD Forex daily chart

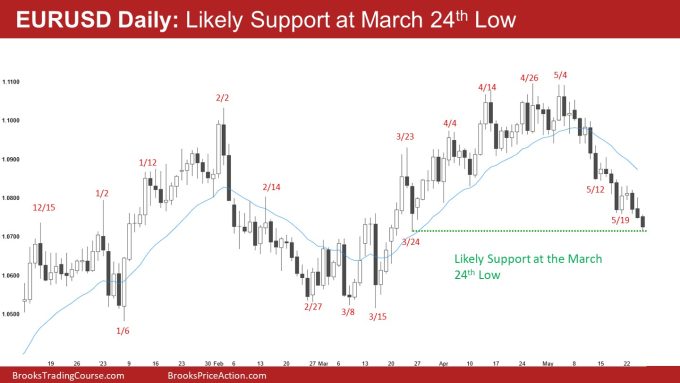
- The EURUSD is getting near the March 24th low and will likely find support near it.
- The channel down is tight, which increases the risk of any reversal being minor.
- The selloff from the May 4th high is a breakout on a higher time frame. This means the selloff can go much further than what seems likely.
- While the market will probably bounce at the March 24th low, traders must be open to the idea of the selloff reaching the March 15th low and possibly breaking below.
- More likely, the market will bounce before the March 15th low.
- The bulls need to develop more buying pressure to stop the bear selloff. They will likely need a double bottom with a decent trendline break of the May 4th selloff before they have a credible swing buy.
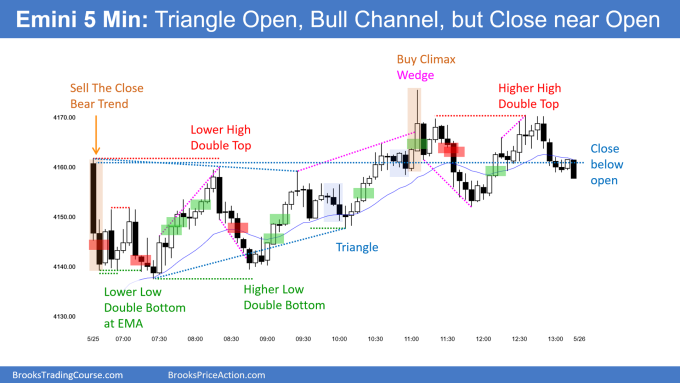
Summary of today’s S&P Emini price action

Al created the SP500 Emini charts.
End of day video review
Live stream video review with Brad Wolff. Here is YouTube link:
Emini End of Day Video Review for Thursday May 25, 2023
See the weekly update for a discussion of the price action on the weekly chart and for what to expect going into next week.
Trading Room
Al Brooks and other presenters talk about the detailed Emini price action real-time each day in the BrooksPriceAction.com trading room days. We offer a 2 day free trial.
Charts use Pacific Time
When times are mentioned, it is USA Pacific Time. The Emini day session charts begin at 6:30 am PT and end at 1:15 pm PT which is 15 minutes after the NYSE closes. You can read background information on the market reports on the Market Update page.

