Emini January effect Trump tax cut rally continuing
Updated 6:45 a.m.
The Emini opened with a big gap up and consecutive big bull bars. In addition, it broke above yesterday’s bull channel. The measured move up from yesterday’s wedge top and from yesterday’s opening gap up are both around 2724. This is an extreme buy climax and therefore there is at least a 50% chance of a 2 hour sideways to down move beginning by the end of the 1st hour or two. While this is a Buy The Close open, it has greater risk. Most traders should therefore wait to buy a pullback because of the risk of an early high of the day.
The bears want a climactic reversal and early high of the day. They need a strong reversal down or 3 consecutive bear bars before traders believe that a TBTL Ten Bar, Two Legged correction has begun.
Pre-Open market analysis
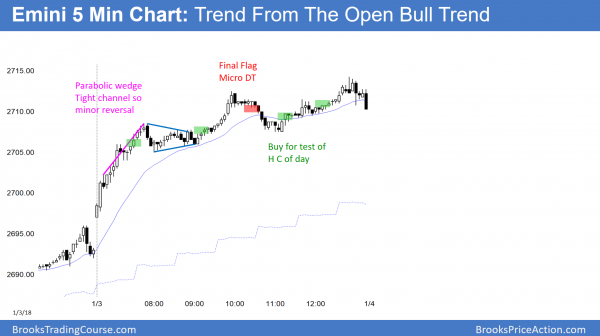
Yesterday was a trend from the open bull trend day. Because it rallied in a big wedge bull channel, the odds favor a transition into a trading range today. There is still no top on the daily chart, despite the buy climax. Therefore, the odds continue to favor higher prices over the next week or so.
There is often buying in early January after December tax selling. This is the January Effect. However, the tight trading range of the past 3 weeks might be a Final Flag. If so, this 2 day breakout will fail within the next week and get pulled back into the range.
Overnight Emini Globex trading
The Emini is up 8 points in the Globex session. If it opens here, it will gap up. However, yesterday’s bull channel had 3 legs up. The gap up would be the 4th leg up in the channel. Channels often have 4 – 5 legs before converting into a trading range. There is a 75% chance of a bear break below the bull channel today. In addition, the breakout will probably result in at least 2 – 3 hours of sideways to down trading. The targets for any selloff are the higher lows in the channel that began with the 8 am pullback yesterday.
Even if there is a 10 point reversal in the next day or two, the bears will likely need at least a micro double top. Therefore, the bulls will buy the 1st pullback, limiting the downside risk over the next couple of days.
Yesterday’s setups
Here are several reasonable stop entry setups from yesterday. I sometimes also show limit order entries and entries on the close of bars.
EURUSD Forex market trading strategies
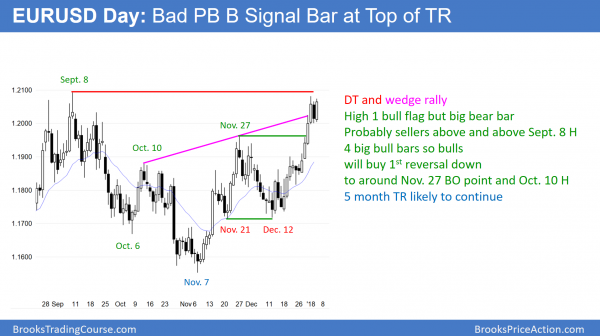
Yesterday was a big bear bar on the EURUSD daily Forex chart and a 1 day pullback. That is a weak buy signal bar, even though it is a High 1 bull flag. In addition there is a double top with the September high. The odds are that there will be sellers above. The daily chart will probably pull back below the November 27 high breakout point over the next 2 – 3 weeks. The bulls will buy the pullback.
Yesterday was a 1 day pullback after a strong 4 day rally. It is therefore a High 1 bull flag. Because it was a bear bar, it is a low probability buy setup. This means that the breakout above will probably not get far. Since the rally is testing the resistance of the September high and the bottom of a 15 year trading range, there is an added reason for a 2 – 3 week pullback.
The daily chart is in a 6 month trading range. That means it usually goes above resistance before beginning a bear leg. In addition, it usually falls below support before rallying again. Traders will begin to sell above yesterday’s high. However, the 3 month rally is strong. In addition, there will probably be buyers between 1.1850 and 1.1900. Since the daily chart is in a bull trend, it is a higher probability trade to buy the pullback than to sell the rally.
Overnight EURUSD Forex trading
The EURUSD 5 minute Forex chart rallied 70 pips overnight to above yesterday’s high. This triggered a buy signal on the daily chart after a 1 day pullback. Since the chart is at resistance and yesterday was a bad buy signal bar, the odds are that traders will begin to sell. Bears will look for day trading scalps and possibly a 100 – 150 pip swing down to below support. Bulls will continue to buy for swings and scalps, but they will be quick to take profits. This is because they know that a pullback will likely begin within a few days.
Summary of today’s S&P Emini futures price action and what to expect tomorrow
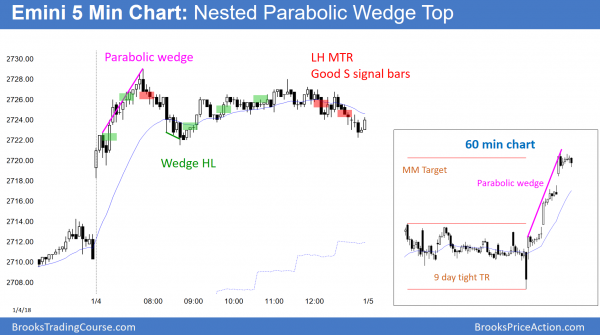
The Emini had parabolic wedge rallies on both the 5 and 60 minute charts. In addition, they formed at a measured move up from the 9 day tight trading range. The buy climaxes led to a trading range day.
The Emini has a parabolic wedge top on the 60 minute chart. Also, it is at a measured move up from the 9 day trading range. The 60 minute chart had a good sell signal bar today, but a bad follow-through bar. The odds are that the Emini will pull back for a day or two.
See the weekly update for a discussion of the price action on the weekly candlestick chart and for what to expect going into next week.
Traders can see the end of the day bar-by-bar price action report by signing up for free at BrooksPriceAction.com. I talk about the detailed S&P Emini futures price action real-time throughout the day in the BrooksPriceAction.com trading room. We offer a 2 day free trial.
When I mention time, it is USA Pacific Standard Time (the Emini day session opens at 6:30 am PST, and closes at 1:15 pm PST). You can read background information on the intraday market reports on the Intraday Market Update page.


Hi Al, Looking at a daily chart we are at the top of a channel. With that being the case. Could this be a new spike and channel pattern? Then ultimately a trading range to determine weather the bulls keep control or the bears get a correction back to a support zone.
I think this is going to be a buy climax. That means a sharp brief PB and then a tight TR for 2 – 4 weeks. Then, a 5% reversal. We’ll see. This is extremely climactic, and when the strongest breakout comes late, it usually leads to a climactic reversal. The last weak bull buys, and the weakest bear finally covers.
Thank you, Al, for the detailed chart today with the 60-Minute inlay. It is very helpful, and much appreciated.
Hi Al, on the Emini 240m Globex chart, the 9-day trading range MM target you talked about is also clear. There are almost all bull bars up to the target but also prominent tails on top of bars and the biggest bull bar late in the trend that looks like a buy vacuum to the target. Is it reasonable to take a higher time frame swing short at the MM target, given the context and possible exhaustion, or would you usually wait for something like a MTR? Thanks for all.
When a rally is as strong as this one has been on the 240 min chart, most bears will wait for a micro DT before shorting. Furthermore, most will only scalp until there is a strong top, which would take at least 10 bars, or a strong reversal down, which would usually be 2 big bear bars or 3 smaller bear bars.
The current inside bar has a bear body. Therefore, some bears will sell above its high, betting that it is a bad buy signal bar, especially when the 5 bar rally might be a buy vacuum test of resistance.
Most likely, the 1st reversal down will be minor. The bears will probably need a couple sideways weeks before many bears will be willing to swing trade.