Emini is in breakout mode on the daily and weekly charts
Updated 6:55 a.m.
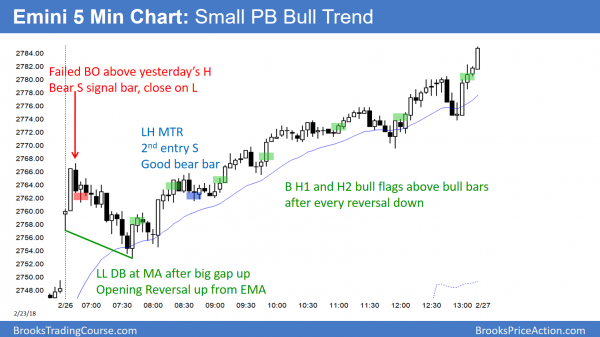
The Emini gapped up on the daily and weekly charts and rallied on the open. However, the early bear bar was a sell signal for a possible high of the day. The bull entry bar created confusion. While the Emini is Always In Long, the early reversals increase the odds of a trading range open.
The bears need a series of bear bars if they are going to get an early high of the day. The bulls do not mind an early selloff as long as they can reverse up from a double bottom around the low of the day and the moving average.
At the moment, an early trading range is likely. If the bulls get trend resumption up over the 1st hour, the odds will favor a trading range lasting several hours after that. If the bears get a strong selloff to far below the low and close the gap, the odds still favor a trading range because Friday’s trend was so strong. This open makes a lot of trading range trading likely today, whether there is 1st a 1 hour rally or selloff.
Pre-Open market analysis
The bulls on Friday broke above an ioi on the daily chart. This triggered a buy signal. Yet, the Emini still in its 5 day tight trading range. The bulls therefore need follow-through buying this week, which they probably will get.
The Emini has consecutive inside bars on the weekly chart. This is an ii Breakout Mode pattern. Theoretically, the bulls buy above and the bears sell below. Because both inside bars are big bull bars closing on their highs and the weekly chart has pulled back to its moving average in a strong bull trend, the odds favor a bull breakout.
However, since the 2 week selloff was strong, a breakout above last week’s high might lack follow-through buying. If so, the weekly chart will continue mostly sideways for at least a couple of weeks. Because it is still in a bull trend, the odds favor a test of the all-time high within a month or two.
Last week’s high is 2754.75. The odds are that today will trade above it and therefore trigger a weekly buy signal. Yet, the huge 2 week selloff created confusion. Therefore, traders might hesitate to continue to buy all of the way up to a new all-time high. Consequently, the bulls might be disappointed by a lack of follow-through buying above last week’s high.
Overnight Emini Globex trading
The Emini is up 9 points in the Globex market. It is therefore currently above last week’s high. If it opens here, it will create a small gap up on the daily and weekly charts. If the bulls can keep the gap open for a few days, they will create a sign of strength. This would increase the odds of a new all-time high before there is another leg down in the developing trading range on the daily chart.
A gap always increases the odds of a trend day up or down. The weekly chart is in a bull trend and has a strong buy setup. Hence, if there is a trend today, it will more likely be up than down. But, traders still do not yet know if the bull trend on the daily chart has resumed or if the strong 2 week rally is just a bull leg in a developing trading range.
What takes place over the next few days should help provide some clarity. If the rally continues up strongly, the odds favor a tight bull channel up to a new all-time high. If the rally stalls within a few day and forms a bear reversal bar, the bears will see a wedge lower high since the February 7 high. That would probably lead to a 2 week bear leg in the range.
Friday’s setups
Here are several reasonable stop entry setups from Friday. I sometimes also show limit order entries and entries on the close of bars.
EURUSD should test below last week’s low, but stay in the 2 month range
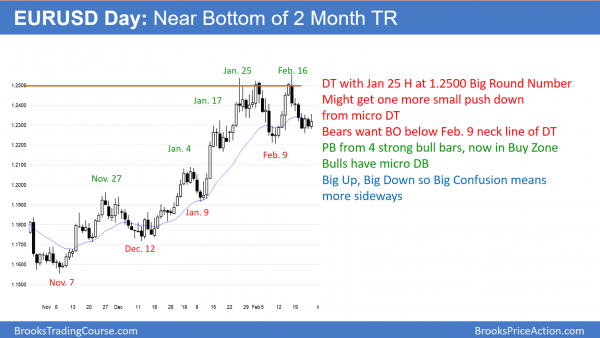
The EURUSD daily Forex chart has been sideways for 4 days. This is both a micro double top bear flag and a micro double bottom higher low.
The EURUSD daily Forex chart is near the bottom of a 2 month trading range. The momentum down over the past 2 weeks has not been strong. This selloff is more likely just a bear leg in the trading range. Because there is a 4 day double top bear flag, the bears might get a 1 – 3 day small leg down to the bottom of the range this week. Yet, the odds are that the breakout attempt will fail. Trading ranges resist breaking out. It is therefore more likely that the daily chart will begin a 150 pip bounce from the 3 day micro double bottom, or after a brief break below the 4 day bear flag.
Sell signal on the weekly chart
Since last week was a bear inside bar on the weekly chart, it is a sell signal bar. In addition, it is a 2nd entry sell on the failed break above 1.25. The odds are that this week will trade below last week’s low and trigger the sell signal. However, since the momentum up on the weekly chart is strong, the odds favor a continuation of the 6 week tight trading range. This means that the sell signal will probably fail to lead to a reversal down. Instead, the 6 week range will continue.
If the bears get a big bear bar this week and a follow-through bear bar next week, traders will conclude that the double top is in control. They then will look for a 300 pip measured move down to around the January 9 low.
Overnight EURUSD Forex trading
The 100 pip tall 4 day trading range on the EURUSD 5 minute Forex chart will probably break out this week. The breakout can be up or down. If there is a down side breakout, it will probably fail within a few days. This is true even if it falls below the February 9 neck line of the 2 month double top. Therefore, the bears will take quick profits unless there is a strong break below that neck line. They will not trust the bear breakout unless it is big and has follow-through bear bars on the daily chart.
The bulls know that a break above the top of the 2 month trading range is unlikely over the next couple of week’s as well. They therefore will take profits above the midpoint of the range, around 1.2450.
The 5 minute chart is deciding whether it will break below the 4 day range and last week’s low before beginning a bull leg for a week or two. Until there is a strong breakout on the 5 minute chart, day traders will continue to take small scalps.
Summary of today’s S&P Emini futures price action and what to expect tomorrow
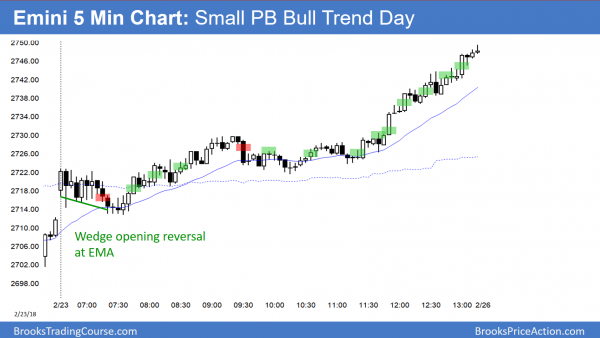
The Emini gapped up on the daily and weekly charts. After a pullback to the moving average, it rallied in a small pullback bull trend. There was an end of the day bear trap that led to a final rally.
By gapping above last week’s high, the Emini triggered a 20 Gap Bar buy signal on the weekly chart. The bulls got a double bottom pullback to the 5 minute EMA. They they created a small pullback bull trend. Because the bull breakouts had big bull bars, they were climactic. Therefore the rally was also a series of buy climaxes. That increases the possibility of exhaustion and a couple hours of trading range trading tomorrow.
The bulls are hoping to get back above the 2817.00 open of the month by Wednesday’s close. They have a 50% chance of getting there by Wednesday’s close. This magnet above increases the odds of higher prices for the next 2 days.
See the weekly update for a discussion of the price action on the weekly candlestick chart and for what to expect going into next week.
Traders can see the end of the day bar-by-bar price action report by signing up for free at BrooksPriceAction.com. I talk about the detailed S&P Emini futures price action real-time throughout the day in the BrooksPriceAction.com trading room. We offer a 2 day free trial.
When I mention time, it is USA Pacific Standard Time (the Emini day session opens at 6:30 am PST, and closes at 1:15 pm PST). You can read background information on the intraday market reports on the Intraday Market Update page.


I just want to say thanks for the daily articles and updating the course. It has helped improve my trading skills greatly.
You’re welcome!
An ioi on the daily chart? It looks like an oio? Am I missing something? Tks.
On the day session Emini chart, February 22 was an inside day following an outside day. That means it is an ioi setup.
But you are right about sometimes a tight trading range will then have an outside bar immediately after the 3rd bar of an ioi. The ioi will then be an ioio, which means the final 3 days were oio.