Trading Update: Friday November 10, 2023
S&P Emini pre-open market analysis
Emini daily chart
- The Emini will likely try to form a High 1 buy setup after yesterday’s large bear breakout bar on the daily chart.
- The breakout that began on October 27th is strong enough to likely get a second leg up, which means traders will look to buy any pullback.
- Because the market is below the October 7th high, it is still in a possible trading range. This means sellers might be above today’s high 1 buy setup, assuming one forms.
- It is typical for High 1 buy setups, which are generally trend resumption patterns, but they often lead to pullbacks first. If today forms a High 1 buy signal bar, there will probably be sellers above, at least for a scalp. However, buyers will likely come in near the low of yesterday’s bar.
- today may be another bear trend bar; however, if it is, it will likely be a disappointing bear bar.
- The bulls are hopeful that today forms a strong High 1 buy signal bar, closing on its high. Next, the bulls want Monday to be a strong entry bar following the High 1 buy setup, trapping bulls out and bears who sold above the High 1.
- The bulls will probably get a second leg up and a test of the September 1st high, which is the start of the bear channel.
- Overall, the odds favor today, disappointing the bears after yesterday’s bear trend bar. However, the bears will probably get a brief second leg down after today’s bar. The second leg down can be just one bar.
Emini 5-minute chart and what to expect today
- Emini is up 20 points in the overnight Globex session.
- The Emini formed a bull breakout over the past two hours on the 60-minute Globex chart. This increases the odds of a second leg up.
- The bears will try and form a large 2nd leg trap with the recent rally on the Globex chart. If this happens, they will need to first halt the buying. Otherwise, the odds favor a second leg up.
- As always, traders will expect the U.S. Session open to have a lot of trading range price action. As I often say, most traders should consider not trading for the first 6 – 12 bars. This is because the open often forms a trading range and forms multiple failed breakouts.
- Traders should consider trying to catch the opening swing that often begins after the end of the second hour. It is typical for the opening swing to begin after the formation of a double top/bottom or a wedge top/bottom.
- Because today is Friday, weekly support and resistance are important. Traders should be mindful of a possible surprise breakout late in the day as traders decide on the close of the weekly chart.
- Traders should pay attention to the midpoint (4,383.5) of yesterday’s bar, as it will likely act as resistance.
- Overall, traders should expect a trading range open until proven otherwise.
Yesterday’s Emini setups

Al created the SP500 Emini charts.
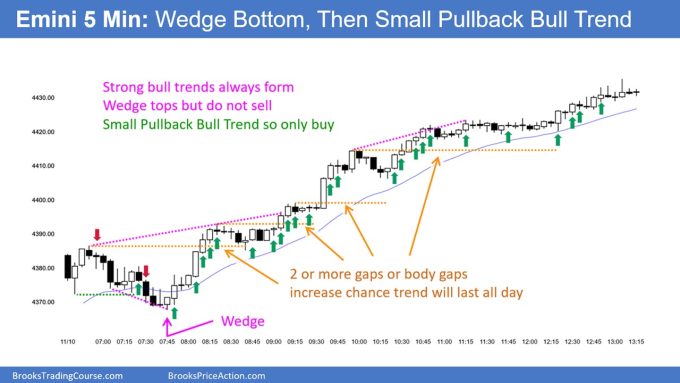
Here are reasonable stop entry setups from yesterday. I show each buy entry bar with a green arrow and each sell entry bar with a red arrow. Buyers of both the Brooks Trading Course and Encyclopedia of Chart Patterns have access to a near 4-year library of more detailed explanations of swing trade setups (see Online Course/BTC Daily Setups). Encyclopedia members get current daily charts added to Encyclopedia.
My goal with these charts is to present an Always In perspective. If a trader was trying to be Always In or nearly Always In a position all day, and he was not currently in the market, these entries would be logical times for him to enter. These therefore are swing entries.
It is important to understand that most swing setups do not lead to swing trades. As soon as traders are disappointed, many exit. Those who exit prefer to get out with a small profit (scalp), but often have to exit with a small loss.
If the risk is too big for your account, you should wait for trades with less risk or trade an alternative market like the Micro Emini.
EURUSD Forex market trading strategies
EURUSD Forex daily chart
- The EURUSD daily chart is deciding on the fate of the recent upside breakout.
- The bulls want a second leg up, and the bears want a bull trap, followed by a strong bear reversal.
- At the moment, the odds favor a second leg up. However, the past four trading days have disappointed the bulls, which will increase the odds of sideways trading.
- Bulls want today to form a bulls reversal bar after yesterday’s outside down bar. The odds will still favor sideways trading even if today develops a bull reversal bar.
- The bears want to form another bear trend bar today, increasing the odds of lower prices.
- Overall, the odds favor the bear becoming disappointed with today.
Summary of today’s S&P Emini price action

Al created the SP500 Emini charts.
See the weekly update for a discussion of the price action on the weekly chart and for what to expect going into next week.
Trading Room
Al Brooks and other presenters talk about the detailed Emini price action real-time each day in the BrooksPriceAction.com trading room days. We offer a 2 day free trial.
Charts use Pacific Time
When times are mentioned, it is USA Pacific Time. The Emini day session charts begin at 6:30 am PT and end at 1:15 pm PT which is 15 minutes after the NYSE closes. You can read background information on the market reports on the Market Update page.


Brad, what do you think the probability of this move being a 2nd leg Bull Trap?
Hi Jason, I have the same doubt… A pullback (30-50%, around 4335-4295) would be likely. At least to touch the 20-EMA. Friday’s bar (10th Nov) was a surprise for me.
holy AI above bar 10!! could you talk about what youd do if you go long above bar 10?
Hi Andrew,
Al would simply wait for second leg and add on at bottom. He talks about this often and some slides are marked up to say same.
If a bear breakout occurs after second leg he would then likely exit for a loss. Cannot win them all. 🙂
I think buying above Bar 10 was reasonable. Bars 2 and 3 were strong reversal bull bars and closed above the open of the day, signifying decent buying pressure. Bar 10 was a H2 at a Double Bottom, above the 20EMA.
I bought Bar 10, exited with a 10 point loss and immediately re-entered again at bar 16 (MAG). Made more than enough profit (far beyond 1:2 RR) to offset that initial loss.
If you bought above bar 10, traders can exit below bar 10 or below bar 11. 11 is a Low 2 short after bear breakout on bar 7 that will likely get a 2nd leg down.
Bar 10 is a reasonable buy, even though it is in a tight bear channel down from the four high. This means that there will be bulls who buy above ten and buy more above a bull bar, such as 15, betting that there is at least a 60% chance the market will retest the ten high.