Trading Update: Wednesday May 25, 2022
Emini pre-open market analysis
Emini daily chart
- Today has the potential for a big move up or down due to the release of the FOMC report today at 11:00 PT.
- The bulls triggered a Low 1 by falling below yesterday’s bull bar on the daily chart.
- The market has been in a tight trading range since May 9th.
- The bulls want a higher low with May 20th and a bounce back to 4,100, around the February 24th low.
- Bears want to continue forming lower highs and lows; however, the channel down to May 20th is likely a bear leg in a trading range. The market will likely form a bull leg in a trading range.
- Another problem the bears have is the weekly chart has seven consecutive bear bars. It is unlikely the bears will get eight consecutive bear bars, which means the market will likely close above the open of the week (3,931).
- Overall, the bulls need to get consecutive strong bull bars similar to March 18 and break above the moving average to convince traders the market is always in long. Until then, the market is in a trading range, which means bulls and bears are likely to be disappointed.
Emini 5-minute chart and what to expect today
- Emini is 22 points down in the overnight Globex session.
- There is an FOMC meeting minutes report released at 11:00 PT.
- Traders should treat today as two different days. This is because the day session can look completely different than it did before the release of the FOMC report.
- Traders should exit any intraday trades an hour before the report and not place a trade until 11:10 PT.
- While one can trade the first 5-minute bar after the 11:00 PT report, there is often a reversal after the 11:05 bar, so best to wait.
- Today has the potential to be slow and a trading range day up until the FOMC report is released.
- The size of the bars can get huge after the FOMC report is released, so it is important to trade small. If one cannot trade small and the bars are too big for them, wait for the next day or for the bars to get smaller.
- Since today will gap down, traders should expect the market to go sideways to the moving average.
- Lastly, traders should treat today’s open like any other day and expect a trading range open. Traders can look for a credible swing buy such as a double bottom/top, wedge bottom/top, or a credible breakout with follow-through.
Yesterday’s Emini setups

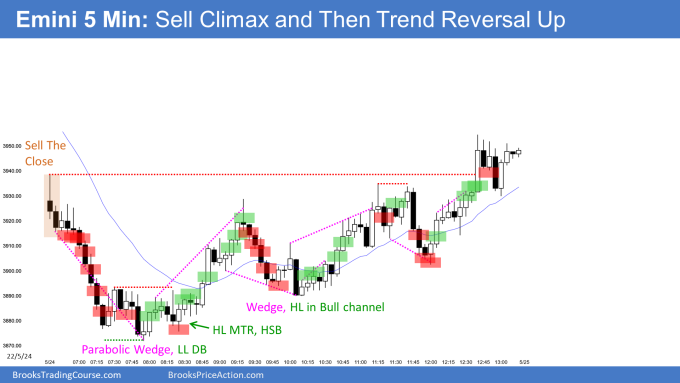
Al created the SP500 Emini charts.
Here are several reasonable stop entry setups from yesterday. I show each buy entry with a green rectangle and each sell entry with a red rectangle. Buyers of both the Brooks Trading Course and Encyclopedia of Chart Patterns have access to a much more detailed explanation of the swing trades for each day (see Online Course/BTC Daily Setups).
My goal with these charts is to present an Always In perspective. If a trader was trying to be Always In or nearly Always In a position all day, and he was not currently in the market, these entries would be logical times for him to enter. These therefore are swing entries.
It is important to understand that most swing setups do not lead to swing trades. As soon as traders are disappointed, many exit. Those who exit prefer to get out with a small profit (scalp), but often have to exit with a small loss.
If the risk is too big for your account, you should wait for trades with less risk or trade an alternative market like the Micro Emini.
EURUSD Forex market trading strategies
EURUSD Forex daily chart

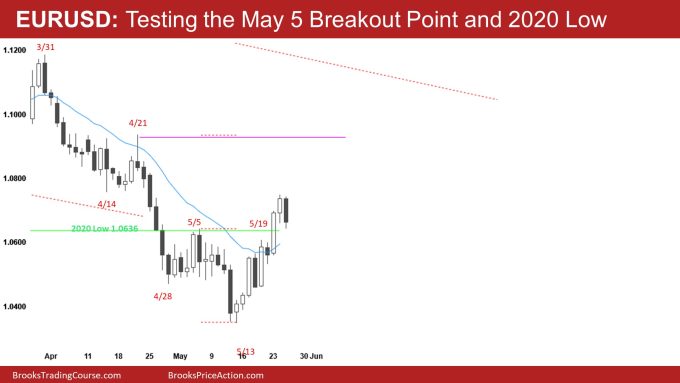
- The market is testing the 2020 Lows and the May 5 breakout point. Bulls will try hard to get the market to reverse back up again.
- So far, the bears have reversed yesterday’s follow-through bar, which is disappointing for the bulls.
- It appears a lot of traders who bought the May 5 high scalped out instead of holding for a swing.
- Today’s current bar is also profit-taking from the test of the April 14 bottom of the two-month trading range.
- The bears see the rally up from May 13 as consecutive buy climaxes and see this as a parabolic wedge top. The problem with that argument is that the rally from May 13 is in an 8-bar bull micro channel, increasing the odds of the first reversal being minor.
- Overall, the market will likely reach the April 21 high. What traders do not know is will the market go straight up to it or will the market have a deep pullback first. The odds are the market will get a deeper pullback than what traders want before it tests the April 21 high.
Summary of today’s S&P Emini futures price action and what to expect tomorrow

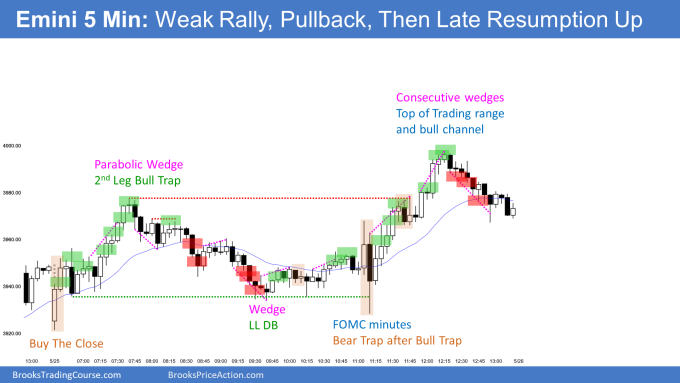
Al created the SP500 Emini charts.
End of day summary
- Today had a weak opening rally, followed by a deep pullback and then a reversal up during the FOMC minutes.
- Today opened with two consecutive bull bars that were strong enough for the market to be always in long and lead to a second leg up. The bulls had the problem of being at the top of a trading range, and yesterday’s close with is resistance.
- The bears got an outside down bar at 7:50 PT, but it failed to trigger and was following three consecutive buyers, so probably buyers below for at least a second leg up.
- The bulls got an upside breakout around 7:30 PT; however, it was a possible parabolic wedge and 2nd leg trap.
- The market had a deep pullback down to around 10:00 PT. At this point, the market was deciding on trend resumption and a test of the 7:35 close or trend reversal down.
- The FOMC minutes broke to the downside, failed, and reversed up with five consecutive bull bars at 11:35 PT. At this point, the odds favored a second leg up.
- The market formed consecutive wedge tops around 12:20 and sold off into the close.
See the weekly update for a discussion of the price action on the weekly chart and for what to expect going into next week.
Trading Room
Traders can see the end of the day bar-by-bar price action report by signing up for free at BrooksPriceAction.com. Al talks about the detailed S&P Emini futures price action real-time throughout the day in the BrooksPriceAction.com on trading room days. We offer a 2 day free trial.
Charts use Pacific Time
When times are mentioned, it is USA Pacific Time. The Emini day session charts begin at 6:30 am PT and end at 1:15 pm PT which is 15 minutes after the NYSE closes. You can read background information on the market reports on the Market Update page.


So grateful for these. Reviewing the Daily Setups have been one of the greatest tools / resources for learning. Thank you!
Im with ya on that one Charlie – my new favorite routine is to draw my lines, highlight the special bars, and comments, and see how close I get to the end of the day summaries.