Trading Update: Thursday July 28, 2022
Emini pre-open market analysis
Emini daily chart
- The bulls got a bull breakout closing above the July 22 high yesterday.
- Bulls want this breakout to have a follow-through test today reaching the June 2nd major lower high. There is a measured move projection from the July 14 low to the June 28 high, which projects to 4,176.25, which is a few points under the June 2 high.
- June 2nd is an important target for the bulls. This is because June 2nd is a major lower high, meaning if the bulls get above it, the market would be in a bull trend or a trading range, and no longer in a bear trend.
- If the bulls get a rally to the June 2nd high, they want the rally to be very strong and have multiple consecutive strong bull closes with small tails above and little overlap of the bars. Similar to the rally in October 2021, it had several bull bars and was a micro channel.
- If the bulls can get a strong rally up to June 2nd, it would lead to a couple of legs up, and possibly a measured move up from the June low to the June high, projecting up to around 4,700.
- The daily chart is in a bear channel converting into a trading range; traders should expect disappointment, which means the bulls will probably not get the above scenario and a test of 4,700 any time soon.
- More likely, the rally up to June 2 will be weak and lead to sideways at the June 2nd high. On the higher time frames (weekly, monthly), the channel down to June 2022 is tight enough that the market could get a second leg down and test the June low. So even if the bulls reach the midpoint of the 2022 selloff, the market may have to test the June lows.
- Overall, traders will pay attention to today’s follow-through to see if the bulls can a second bull close or if something disappointing such as a bad follow-through bar.
Emini 5-minute chart and what to expect today
- Emini is up 9 points in the overnight Globex session.
- The Globex has been sideways since yesterday’s close.
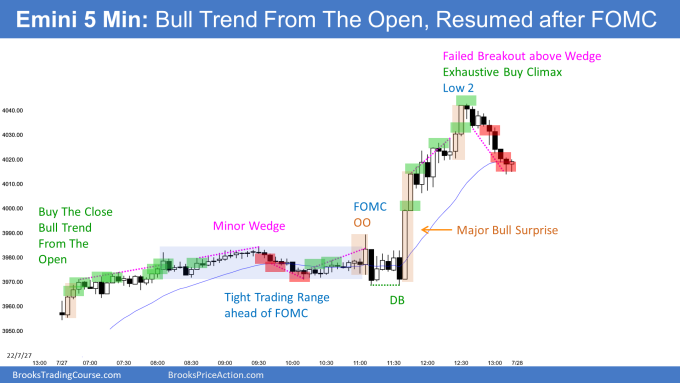
- On the open, traders must be mindful that the market may try to get a second leg up from the 11:40 and 11:45 consecutive big bull trend bars. The bulls want the market to reach the measured move projection of 4,057.5, and it is reasonable the bulls will get there.
- Traders will expect a trading range open this morning, and until there is a breakout, there is no breakout.
- Traders should expect sideways until they see a credible breakout with follow-through.
- Since the open will likely be a limit order market, traders should wait for a credible bottom such as a double bottom/top, wedge bottom/top, or a credible breakout with follow-through.
- It is essential on the open to be careful since reversals are common, and it is easy to take 1-2 big losses and spend the rest of the day trying to get back to breakeven.
- Most important thing to remember is to not be in denial on the open. If the market is getting strong consecutive trend bars, a trader needs to find a way to get in the direction of the trend. If the market goes sideways, traders must wait for a credible setup or strong breakout.
Yesterday’s Emini setups

Al created the SP500 Emini charts.
Here are several reasonable stop entry setups from yesterday. I show each buy entry with a green rectangle and each sell entry with a red rectangle. Buyers of both the Brooks Trading Course and Encyclopedia of Chart Patterns have access to a much more detailed explanation of the swing trades for each day (see Online Course/BTC Daily Setups).
My goal with these charts is to present an Always In perspective. If a trader was trying to be Always In or nearly Always In a position all day, and he was not currently in the market, these entries would be logical times for him to enter. These therefore are swing entries.
It is important to understand that most swing setups do not lead to swing trades. As soon as traders are disappointed, many exit. Those who exit prefer to get out with a small profit (scalp), but often have to exit with a small loss.
If the risk is too big for your account, you should wait for trades with less risk or trade an alternative market like the Micro Emini.
EURUSD Forex market trading strategies
EURUSD Forex daily chart

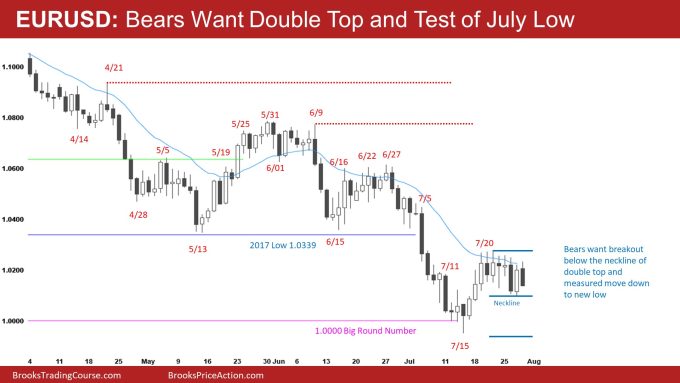
- The bears are currently trying to reverse yesterday’s bull breakout. The bears want a breakout below yesterday’s low which would be the neckline of a double top. They hope this will lead to a measured move down and test of the July 14 low.
- I mentioned in a prior blog post that the market might have to retest the 1.0000 big round number before reaching the 2017 low. The market may be trying to do that right now.
- Even if the market falls below the July 14 low, the odds favor a double bottom and test of the 2017 low.
- The bears need to get a strong close on its low and not allow a tail below the bar. This would entice more bears to sell.
- More likely, today will be disappointing for the bears and bulls, and the market will continue sideways. Some sell-the-close bears sold at the close of July 26th; some will be disappointed enough to buy back shorts during today’s selloff testing the July 26 close.
Summary of today’s S&P Emini futures price action and what to expect tomorrow

Al created the SP500 Emini charts.
End of day summary
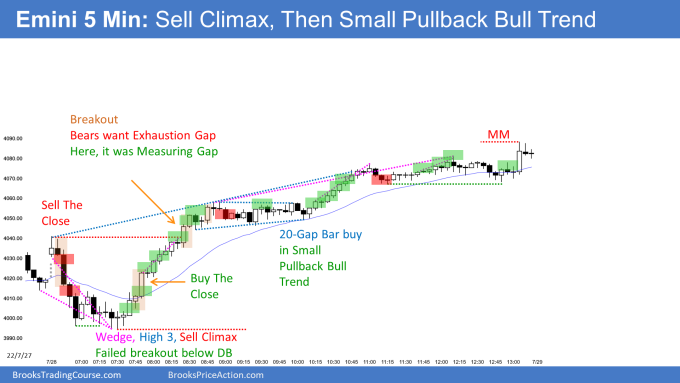
- The market had a sell climax on the open, leading to a small pullback bull trend day.
- The bears got a strong bear breakout on the open, leading to a wedge bottom and the day’s low.
- The bulls saw the opening selloff as a large two-legged pullback from the FOMC rally yesterday and wanted an early reversal up, which they got.
- The market broke above the moving average around 7:50 PT and became Always In long.
- Yesterday’s s 11:40 and 11:45 were strong enough breakout bars to lead to a measured move up, so traders needed to pay attention to the measured move target based on the bodies of those bars today. The measured move from yesterday’s 11:40 Open to 11:45 close was reached during 8:45 PT.
- The rally up to 8:30 was a buy the close rally, and the odds favored higher prices. The bulls were happy to buy, knowing the odds favored sideways trading, and the bulls could exit if the market went sideways.
- The market continued in a small pullback bull trend day for the rest of the day.
- Overall, today was great for the bulls. The bulls now have a strong breakout and follow-through above the July 22 high, increasing the odds of the market getting to the June 2nd high.
See the weekly update for a discussion of the price action on the weekly chart and for what to expect going into next week.
Trading Room
Traders can see the end of the day bar-by-bar price action report by signing up for free at BrooksPriceAction.com. Al talks about the detailed S&P Emini futures price action real-time throughout the day in the BrooksPriceAction.com on trading room days. We offer a 2 day free trial.
Charts use Pacific Time
When times are mentioned, it is USA Pacific Time. The Emini day session charts begin at 6:30 am PT and end at 1:15 pm PT which is 15 minutes after the NYSE closes. You can read background information on the market reports on the Market Update page.


Thanks Brad for an excellent report. Just a side note re daily chart, bulls have a decent close above the low of February (24th) the day that Putin invasion Ukraine and also above 100EMA. 100SMA is not yet there.
As I expected the market formed wedge bear flag and bull BO above wedge. As AL says either it could be buy climax or test of major LH or HH.
THANKS so much AL for sharing your knowledge with us. It is literally priceless