Trading Update: Thursday April 4, 2024
S&P Emini pre-open market analysis
Emini daily chart
- The Emini is finding support at the daily moving average and the March 8th breakout point.
- While the bears have done a good job closing breakout points, the best they can realistically hope for is a trading range, not a bear trend.
- If the bears develop a bear trend on the daily chart, they need to create more selling pressure below the moving average.
- The bulls will see the market as either in a bull trend or a trading range. This means that they will look to buy at support in hopes of the market resuming its trend and, at minimum, testing the top of the trading range.
- Overall, traders should expect the market to continue to go sideways and for the market to develop more trading range price action. Bulls will likely be disappointed near the recent highs on the daily chart.
Emini 5-minute chart and what to expect today
- The Globex market rallied an hour before the U.S Open. This increases the odds that the bulls will get an attempt at a second leg up someone during the first 1-2 hours of the Open.
- Traders should expect the open to have a lot of trading range price action, which means traders can consider waiting 6-12 bars before placing a trade.
- Most traders should try to catch the opening swing, which often begins before the end of the second hour and after the formation of a double top/bottom or a wedge top/bottom.
- Traders should pay attention to the opening of the day, as it will likely become an important magnet today.
- There is an 80% chance of a trading range open and only a 20% chance of a trend from the open. If today is going to be a trend day, the odds favor a bull trend because of the gap up.
Yesterday’s Emini setups

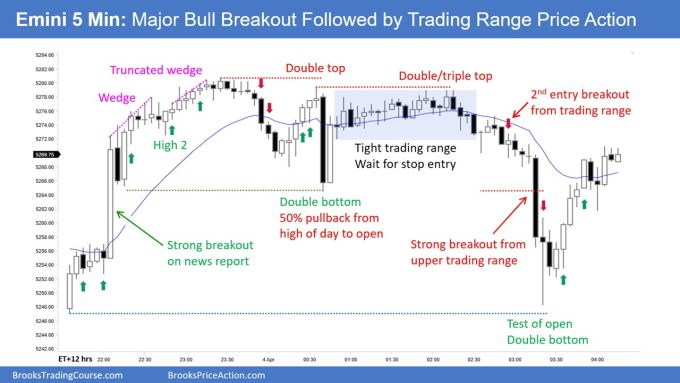
Richard created the SP500 Emini charts (Al travelling).
Here are reasonable stop entry setups from yesterday. I show each buy entry bar with a green arrow and each sell entry bar with a red arrow. Buyers of both the Brooks Trading Course and Encyclopedia of Chart Patterns have access to a near 4-year library of more detailed explanations of swing trade setups (see Online Course/BTC Daily Setups). Encyclopedia members get current daily charts added to Encyclopedia.
My goal with these charts is to present an Always In perspective. If a trader was trying to be Always In or nearly Always In a position all day, and he was not currently in the market, these entries would be logical times for him to enter. These therefore are swing entries.
It is important to understand that most swing setups do not lead to swing trades. As soon as traders are disappointed, many exit. Those who exit prefer to get out with a small profit (scalp), but often have to exit with a small loss.
If the risk is too big for your account, you should wait for trades with less risk or trade an alternative market like the Micro Emini.
EURUSD Forex market trading strategies
EURUSD Forex daily chart
- The Bulls got a strong entry bar closing above the moving average following a parabolic wedge at the February 14th buy signal bar high.
- Yesterday’s entry bar was strong enough to trap bears into a bad short position. This increases the odds of a second leg up and test of the March 21st lower high.
Summary of today’s S&P Emini price action

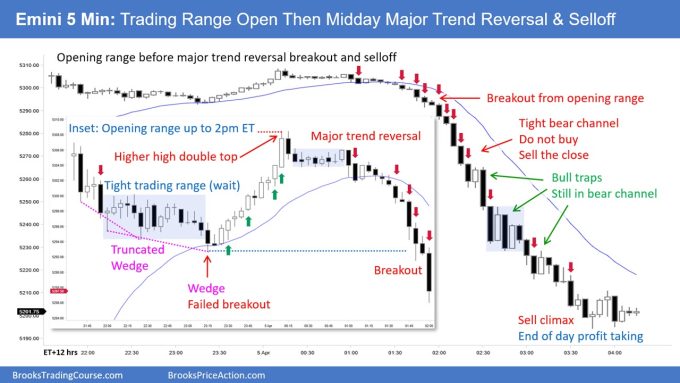
Richard created the SP500 Emini charts (Al travelling).
End of day video review
End Of Day Review will be presented in the Trading Room today. See below for details on how to sign up.
See the weekly update for a discussion of the price action on the weekly chart and for what to expect going into next week.
Trading Room
Al Brooks and other presenters talk about the detailed Emini price action real-time each day in the BrooksPriceAction.com trading room days. We offer a 2 day free trial.
Charts use Pacific Time
When times are mentioned, it is USA Pacific Time. The Emini day session charts begin at 6:30 am PT and end at 1:15 pm PT which is 15 minutes after the NYSE closes. You can read background information on the market reports on the Market Update page.


Richard, really appreciate the way you mark the charts up. In particular the insets and the comments. Well done and thank you so much.
Thanks Christopher. Happy to hear it works for you.
I just purchased my orlando ticket ..very excited Al helped me begin trading years ago ..I’ve sailed around the horn with different ways to trade but most of it is just a mess on your chart I’m looking for a great time !!!
Look forward to meeting up Lonnie. Great.