Trading Update: Friday April 26, 2024
S&P Emini pre-open market analysis
Emini daily chart
- The Emini triggered a Low 1 short yesterday, with April 24th being the signal bar, and went outside up. Outside bars are expanding triangles on lower time frames. Outside bars are trading range bars, which means they are very context-dependent.
- The bears were hopeful that the rally up to April 24th was a bear flag that would get a downside breakout. Instead, the market found buyers below the April 24th low.
- Low 1 setups are always a variation of a double bottom, which means there are always disappointed bears who sold the low of the move and are interested in getting out on a retest of the extreme (April 19th).
- When trends are strong, traders are less interested in taking profits at the extreme of the move. Thus, Low 1 setups in this context have a higher probability of getting trend resumption.
- Because the market is finding support at the 5,000 round number, this increased the probability of buyers below the April 24th low 1.
- While the Low 1 failed, which was expected, it is typical for Low 1 setups, such as April 24th, to get retested after the market forms a deeper pullback.
- The bulls are hopeful they can form a strong upside breakout. However, as mentioned above, yesterday was an outside bar, which increase the odds of sideways trading and sellers above.
- The bulls need to break above the moving average to convince traders they are in control.
- It is important to remember that the daily chart is in a trading range, which increases the odds
- of sideways trading.
- The selloff down to the 5,000 round number is a trendline break following a tight bull channel. This increases the odds that the bears will need a major trend reversal setup, meaning the market must retest the April high.
Emini 5-minute chart and what to expect today
- The Globex market has been in a tight trading range on the 15-minute chart for most of the overnight session.
- The bulls formed an upside breakout during the 8:30 AM EST report. However, it was a retest of yesterday’s high, where the bears overwhelmed the market, leading to a reversal.
- The bears want a breakout below the Globex tight trading range and a test down to yesterday’s breakout point at 5,090.75 (3:30 PM EST).
- Traders should assume that today’s open will have a lot of trading range price action on the open. This means that most traders will be better off waiting for 6-12 bars before placing a trade.
- Most traders should try to catch the opening swing that often begins before the end of the second hour.
- It is common for the market to form a double top/bottom or a wedge top/bottom before the opening swings. This means a trader can often wait for one of the above-mentioned patterns to form before placing a trade.
Yesterday’s Emini setups

Al created the SP500 Emini charts.
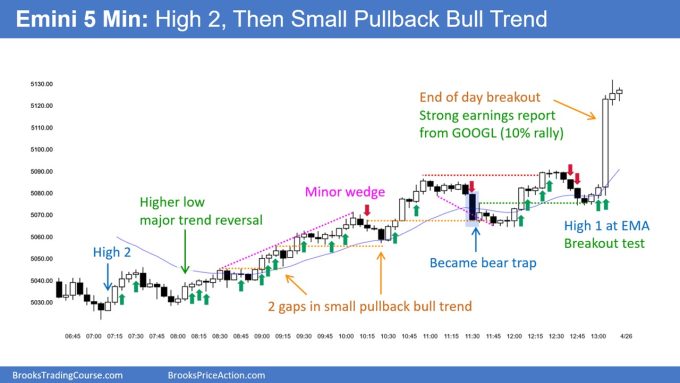
Here are reasonable stop entry setups from yesterday. I show each buy entry bar with a green arrow and each sell entry bar with a red arrow. Buyers of both the Brooks Trading Course and Encyclopedia of Chart Patterns have access to a near 4-year library of more detailed explanations of swing trade setups (see Online Course/BTC Daily Setups). Encyclopedia members get current daily charts added to Encyclopedia.
My goal with these charts is to present an Always In perspective. If a trader was trying to be Always In or nearly Always In a position all day, and he was not currently in the market, these entries would be logical times for him to enter. These therefore are swing entries.
It is important to understand that most swing setups do not lead to swing trades. As soon as traders are disappointed, many exit. Those who exit prefer to get out with a small profit (scalp), but often have to exit with a small loss.
If the risk is too big for your account, you should wait for trades with less risk or trade an alternative market like the Micro Emini.
Summary of today’s S&P Emini price action

Al created the SP500 Emini charts.
End of day video review
End Of Day Review will be presented in the Trading Room today. See below for details on how to sign up.
See the weekly update for a discussion of the price action on the weekly chart and for what to expect going into next week.
Trading Room
Al Brooks and other presenters talk about the detailed Emini price action real-time each day in the BrooksPriceAction.com trading room days. We offer a 2 day free trial.
Charts use Pacific Time
When times are mentioned, it is USA Pacific Time. The Emini day session charts begin at 6:30 am PT and end at 1:15 pm PT which is 15 minutes after the NYSE closes. You can read background information on the market reports on the Market Update page.


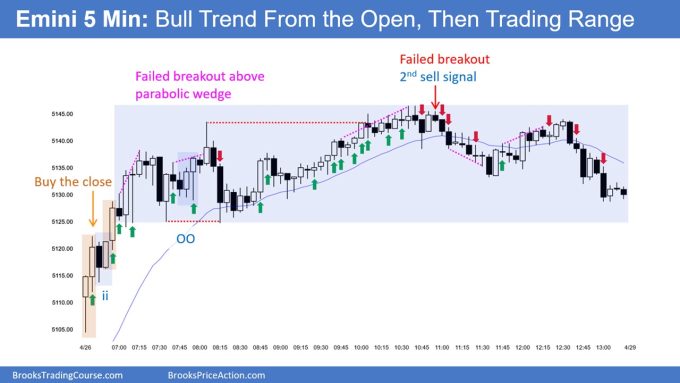
On latest summary: Most of the buy indications in middle of day are in upper half TR. Why is that okay here? Is it because of the strength of the trend on the open, that it’s reasonable to expect higher high of day?
Hi Casper,
I agree with you that the overall day is a trading range. However, it is also a trend from the open bull trend.
The reason for all of the buys in the middle of the day is that the market is getting small pullback bull trend behavior. Notice all the bars are completely above the moving average. This is a sign of trending behavior and increases the odds that the first reversal down will fail, which is why the selloff down to 11:30 AM PT formed a deep pullback testing near the highs.
Hope this helps,
Brad
Thank you Brad, that was helpful.
I’m now rewatching “Entering Late in Trends”. I really need to learn buying in these situations, even if simultaneously in TR, using correct amount based on stop and then stay in the trade until clear reversal setup, or market coming back from failed reversal (possibly scaling in). Missing too many trends otherwise.