Trading Update: Thursday August 18, 2022
Emini pre-open market analysis
Emini daily chart
- Emini exhausted with likely pullback 300 points down before it rallies another 300 points.
- It is important to remember that exhaustion means the market went too far too fast. Exhaustion often leads to trading range price action and not an opposite trend. This means bulls will likely buy any pullback from this rally.
- The market is stalling at the 200-day moving average, which is resistance.
- The bulls still want to get to the April 18 low (4,366.5), a breakout gap from the April 22 bear breakout.
- The bear trendline from the January and March lower high is within 100 points, and the market will likely have to reach it soon.
- There will likely be sellers back at the April 18 low when the market gets back to it.
- The bears need to develop more selling pressure before traders are convinced the market will go much lower. At a minimum, the bears need to create a micro double bottom, which will likely lead to a minor reversal.
- The market has likely put in the year’s low; it is likely to test the 4,000 big round number before it rallies up to 4,600.
- Overall, traders will expect the market to begin to go sideways soon as it approaches obvious resistance not far above.
Emini 5-minute chart and what to expect today
- Emini is up 1 point in the overnight Globex session.
- The odds favor a trading range open and limit order market.
- If the market creates strong consecutive trend bars on the open, traders will begin to bet on the breakout; however, until then, most traders will bet against breakouts.
- It is essential to be patient on the open since most breakouts fail and reverse.
- As Al often says, if today is going to be a strong trend day, there will be plenty of time to enter the trend’s direction.
- As I often say, most traders should consider waiting for 6-12 bars on the open before placing a trade. This is because most days go sideways for the first hour on the open, so there is no rush to enter the market.
- It is essential to trade the market in front of you, not what one hopes the market will do.
- One of the most common things traders do that causes them to lose is being too aggressive on the open. The bars are usually big; all it takes is one or two big losses, and one will have to spend the entire day trying to break even. The key is to be patient and wait for a credible swing setup or strong breakout with follow-through.
- As Al often says, most traders take plenty of good trades; but they also take too many “dumb trades” with poor math.
- Overall, if the first two hours has a lot of trading range price action, traders should assume the day will be a trading range or a trend trading range day.
Yesterday’s Emini setups

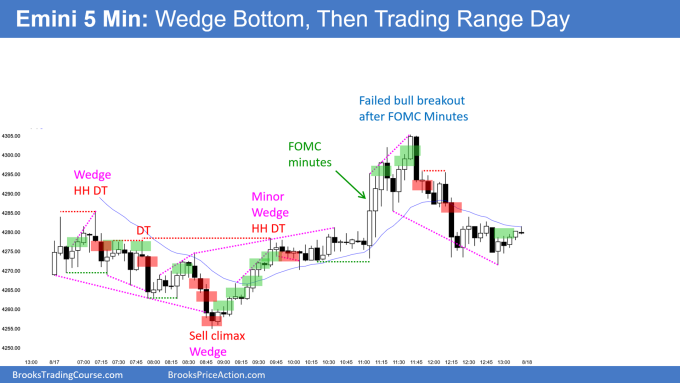
Al created the SP500 Emini charts.
Here are several reasonable stop entry setups from yesterday. I show each buy entry with a green rectangle and each sell entry with a red rectangle. Buyers of both the Brooks Trading Course and Encyclopedia of Chart Patterns have access to a much more detailed explanation of the swing trades for each day (see Online Course/BTC Daily Setups).
My goal with these charts is to present an Always In perspective. If a trader was trying to be Always In or nearly Always In a position all day, and he was not currently in the market, these entries would be logical times for him to enter. These therefore are swing entries.
It is important to understand that most swing setups do not lead to swing trades. As soon as traders are disappointed, many exit. Those who exit prefer to get out with a small profit (scalp), but often have to exit with a small loss.
If the risk is too big for your account, you should wait for trades with less risk or trade an alternative market like the Micro Emini.
EURUSD Forex market trading strategies
EURUSD Forex daily chart

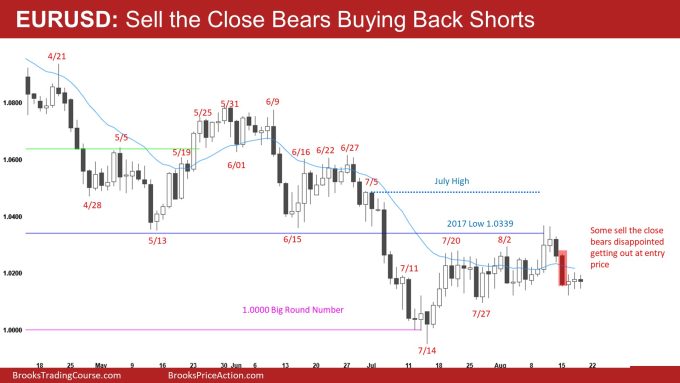
- Some of the Sell the Close bears who sold the August 15 close are disappointed and are buying back shorts at their entry price. They sold at the close of August 15, betting on quick follow-through, and are disappointed by the past two days. This will increase the odds of being more sideways.
- The bulls know the Sell the Close bears are disappointed and will buy where those bears are exiting.
- Some bears will stay short, betting that the August 15 bear trend bar will get the 2nd leg down.
- If one senses confusion when they look at the EURUSD daily chart, they are reading it correctly.
- The probability is neutral, and traders should assume a 50% probability of breakout up or down.
- The market may have to test down to the 1.0000 big round number and form a double bottom major trend reversal. Most bulls would prefer this as it would allow them to buy low in a trading range or early stages of a bull trend.
- The odds favor that the market will test the middle of the June – July trading range sometime over the next three months.
- The bears want the market to breakout below the neckline of the July 27 low and go for a measured move down and break below the 1.000 big round number, which is unlikely.
- Overall, traders should wait to see the breakout since the probability is neutral here.
Summary of today’s S&P Emini futures price action and what to expect tomorrow

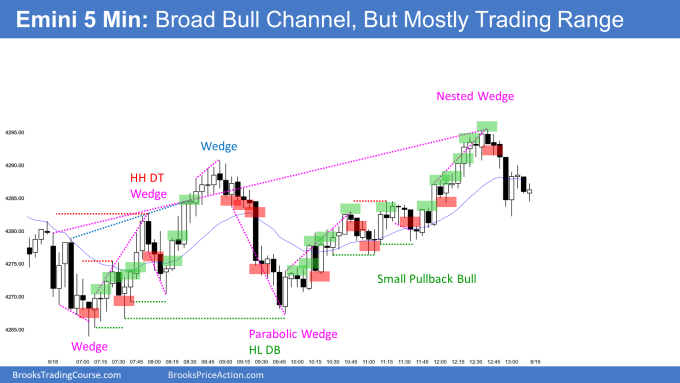
Al created the SP500 Emini charts.
End of day video review
See the weekly update for a discussion of the price action on the weekly chart and for what to expect going into next week.
Trading Room
Traders can see the end of the day bar-by-bar price action report by signing up for free at BrooksPriceAction.com. Al talks about the detailed S&P Emini futures price action real-time throughout the day in the BrooksPriceAction.com on trading room days. We offer a 2 day free trial.
Charts use Pacific Time
When times are mentioned, it is USA Pacific Time. The Emini day session charts begin at 6:30 am PT and end at 1:15 pm PT which is 15 minutes after the NYSE closes. You can read background information on the market reports on the Market Update page.


I really like the end of day video review, thanks for making this educational and understandable.