Posted 7:11 a.m.
The Emini formed a nested wedge top on Friday. Friday’s wedge top was the 3rd leg up in a larger, 4 day wedge top.
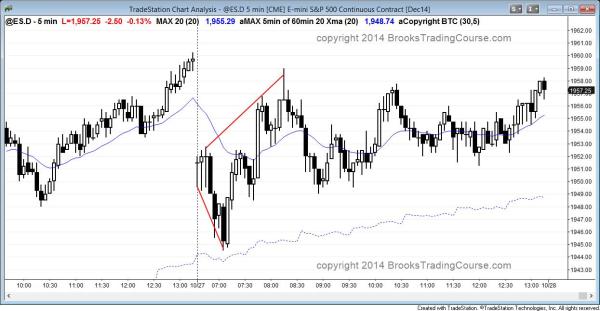
After 3 dojis on the open, the Emini had a bear breakout. Support below is the 60 minute moving average, yesterday’s low, and the bottom of the 4 day wedge. Because the 5 minute chart has been in a two day trading range, traders are aware that the initial selloff might lead to an opening bull trend reversal.
The selloff was weak and this increases the chances that it is a bear leg within the two day trading range. Although the Emini is currently always in short, traders will be prepared to buy if there is a strong bottom, like a parabolic wedge bottom, or a strong upside breakout. It might form an opening bull trend reversal at the 60 minute moving average.
This is trading range price action so far, but it can have swings up and down. It is still possible to become a trend day, but it needs a strong breakout up or down to do so.
The Emini has rallied strongly for 2 weeks after a parabolic sell climax 2 weeks ago. However, it has not yet gone above the October 6 and 8 lower highs. This means that the current rally might still be a buy vacuum test of resistance in a broad bear channel. It could then form another lower high and lead to a new low, below the low of the month.
The monthly candle closes this week. At the moment, the candle is a big reversal bar. The FOMC report is on Wednesday and it can lead to a big move up or down. If there is a strong rally on the report, it is possible that October may even close above the September high, which was the all-time high. This would create an outside up month. When one forms late in a bull trend, it is more likely an exhaustive move instead of a breakout, but it is still possible that the bull trend on the monthly chart can go much higher before transitioning into a monthly trading range.
Because the monthly chart is so overbought, I think that it is more likely going to transition into a trading range. For example, if there is a big selloff after the FOMC report on Wednesday, that would create a big bear bar, which would increase the chance that the trading range has begun on the monthly chart. The daily chart has been in a trading range for all of 2014.
Day trading outlook for tomorrow’s Emini price action

The Emini had a parabolic wedge bottom on the open that was an opening reversal up from the 60 minute moving average. It then formed a wedge lower high and entered a triangle. It closed near the high of the day, but was a small bull inside day on the daily chart.
Today was a small bull inside day in an overbought market on the daily chart. It is within the October 2 to 8 double top and bottom. The bulls failed to get an upside breakout 3 weeks ago, and the result was a very strong bear breakout. The bulls want a breakout above and then a measured move up to an all-time high. The bears don’t mind if there is a new high because they expect a major trend reversal after the gap bar on the weekly chart.
The Emini might stay sideways into Wednesday’s FOMC report and then breakout up, down, or both. The breakout also might occur before the report.
This is the third consecutive trading range day, and that increases the chances that tomorrow will be a trading range day as well. However, the targets are just above and the Emini might get a bull breakout within the next couple of days. If there is a bear breakout, the downside is probably limited by the strength of the rally over the past 2 weeks.
Premarket price action analysis
See yesterday’s intraday market update report for today’s premarket analysis. Once there, scroll down to the heading, Day trading outlook for tomorrow’s Emini price action.
See the weekly update for a discussion of the weekly chart and for what to expect going into next week.
Traders can see the end of the day bar-by-bar price action report by signing up for free at BrooksPriceAction.com. I talk about the detailed Emini price action real-time throughout the day in the BrooksPriceAction.com trading room, and a 2 day free trial is available.
When I mention time, it is USA Pacific Standard Time (the Emini day session opens at 6:30 am PST, and closes at 1:15 pm PST). You can read background information on the intraday market reports on the Intraday Market Update page.

