Emini daily double top bear flag but weekly bull flag
Updated 6:45 a.m.
The Emini gapped up big and had a High 1 bull flag on the 2nd bar. However, the 1st bar was a big bear bar and the buy signal bar had a big day. Both reduce the odds of a trend from the open bull trend. Furthermore, they increase the chances of a sideways to down market for the 1st hour. If that happens, the bulls will try to create a bull flag near the EMA.
The bears are trying to make the breakout fail. However, they will need at least 2 consecutive big bear bars before traders see a reversal as a possible bear trend. Without that, traders will see any selloff as a probably bull flag.
Pre-Open market analysis
The Emini sold off in a broad bear channel yesterday, but rallied strongly into the close. That makes higher prices likely today. While it formed a double top with Tuesday’s high on the daily chart, it had a bull body. The bears want a 2nd leg down from the month-long double wedge top. However, yesterday’s bull body makes it a weak sell signal bar. In addition, there is a measured move target at 2750 on the 60 minute chart.
Today is Friday and therefore the weekly chart is important. The week so far is a bull inside bar closing near its high. Furthermore, it is a 2nd entry buy signal bar in a bull trend at the 20 week moving average. If today closes near the high of the week, this week will be a strong buy signal bar on the weekly chart.
The Emini will decide next week whether the daily chart will have a 2nd leg down from its wedge rally. Alternatively, traders will decide if the weekly High 2 bull flag will lead to a rally. This week will probably close near its high. That favor higher prices next week.
Targets for the bulls
The next major target for the bulls is the February 27 high of 2794.75. That is the top of a 3 day sell climax and it is therefore a major lower high. It is probably too far up for the bulls to reach it today.
The bears want a lower high or double top with that high. They would then try to get a 2nd leg down from the wedge top on the daily chart. The bulls want a strong breakout above, and then a test of the January all-time high of 2880.25.
Overnight Emini Globex trading
The Emini is up 19 points on the unemployment report. It will therefore likely gap far above yesterday’s high. Furthermore, the bar on the weekly chart will probably close near its high. This will make higher prices likely next week.
A gap up increases the chances of a trend day up or down. When a gap is big, it increases the odds of a bull trend day. When there is a big gap up, the price is far above average. There is only a 20% chance of either a strong trend from the open bull or bear trend.
What usually happens is that the Emini goes mostly sideways for an hour or so until it gets closer to the 20 bar EMA. It can rally several bars or sell off several bars on the open, but it then usually works it way back to the average price.
Sometimes the selloff is strong. Yet, it can still lead to an Opening Reversal up from the EMA and then a strong bull trend day. The bulls will look for a double bottom, or a High 2 or wedge bull flag at the moving average. If they get one, traders will look for a reversal up into a bull trend day.
There is a 20% chance of a big bear trend day today. The bears want the breakout above yesterday’s high to fail. They typically need at least a micro double top. They also then need several big bear bars closing near their lows. If a gap up is going to lead to a bear trend day, the bears will need a strong break below the EMA.
Yesterday’s setups
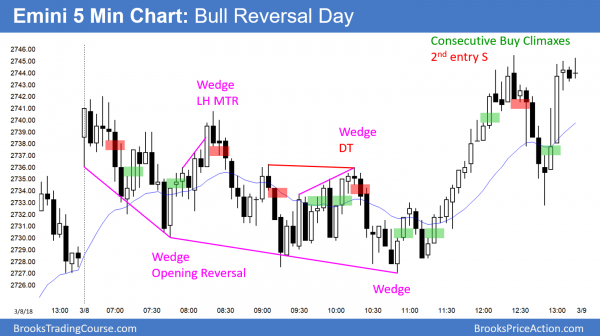
Here are several reasonable stop entry setups from yesterday. I sometimes also show limit order entries and entries on the close of bars.
EURUSD trading range day likely
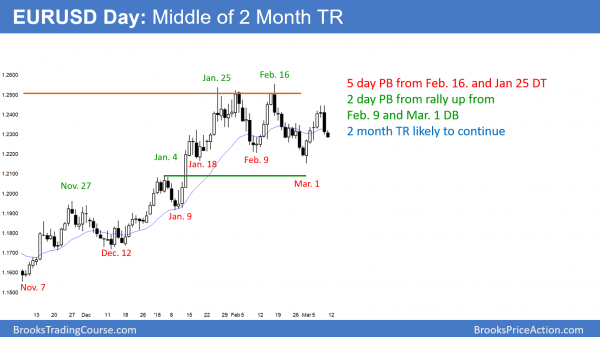
The EURUSD daily Forex chart is in the middle of a 2 month trading range. The bulls see the past 2 days as a pullback from a 5 day rally up from a month-long double bottom. However, the bears see that 5 day rally as a pullback from a month-long double top. There is no evidence of an impending breakout.
The EURUSD daily Forex chart was in a strong bull trend in 2017. It has been in a trading range in 2018. Like all trading ranges, there is both a double bottom and a double top. Furthermore, there is no evidence that there will be a breakout up or down within the next several weeks.
I wrote earlier this week that the bears would likely get a 150 pip selloff this week. That came over the past 2 days. The 5 day rally was strong enough so that the selloff will probably bounce here after a 50% pullback from the 5 day rally. The daily chart will probably pause here for a couple of days before trying to bounce next week.
Traders will watch for signs buying or selling pressure before deciding whether it will next test the March 1 bottom or the February 16 top of the range.
Overnight EURUSD Forex trading
After retracing half of the 5 day rally, the EURUSD 5 minute Forex chart will probably go sideways today. The 5 day rally was stronger than the 2 day selloff. As a result, the EURUSD is more likely to bounce 70 – 100 pips over the next few days than sell off that amount. However, after Big Up, Big Down moves over the past 2 weeks, the EURUSD usually becomes a scalper’s market for at least a day or two.
Summary of today’s S&P Emini futures price action and what to expect tomorrow
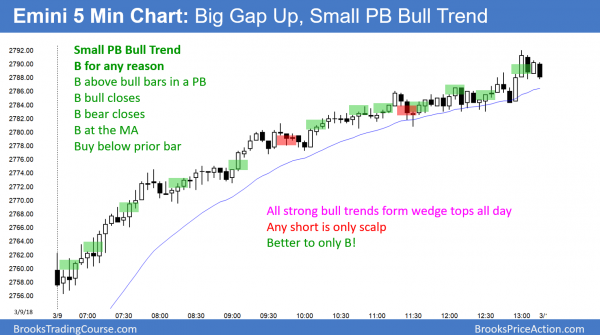
Today gapped up and formed a trend from the open, small pullback bull trend. Only look to buy.
Today was a strong bull trend day. It closed near last week’s high. This week is a buy signal bar on the weekly chart for next week. The bears want a double top with last week’s high. That high is the top of a wedge on the daily chart. Since the weekly chart has a good buy setup, the odds favor a break above the high next week. Next week might gap up.
See the weekly update for a discussion of the price action on the weekly candlestick chart and for what to expect going into next week.
Traders can see the end of the day bar-by-bar price action report by signing up for free at BrooksPriceAction.com. I talk about the detailed S&P Emini futures price action real-time throughout the day in the BrooksPriceAction.com trading room. We offer a 2 day free trial.
When I mention time, it is USA Pacific Standard Time (the Emini day session opens at 6:30 am PST, and closes at 1:15 pm PST). You can read background information on the intraday market reports on the Intraday Market Update page.


