Trading Update: Friday January 5, 2024
S&P Emini pre-open market analysis
Emini daily chart
- The Emini formed another bear bar on the daily chart, closing below the daily moving average.
- While the bears have done a good job getting a bar below the moving average, it is the first time the market has reached the moving average in well over 40 bars. This increases the probability of the buyer at his price level of at least a small bounce.
- The bears hope to collect bear bars closing below the moving average.
- Without more bear bars, the probability favors a bounce.
- Bulls buying at this price level will probably buy a scalp, not a swing. With the bears getting a five-bar bear microchannel, the odds favor a second leg down. However, the pullback could be deep before the bears get their second leg down.
Emini 5-minute chart and what to expect today
- The Bulls are getting a rally before the U.S. open in the Globex market.
- Because the market is at important support on the daily chart, the odds favor a bounce today, and the bears are getting disappointed.
- As always, traders should assume that today will have a lot of trading range price action and disappoint swing traders on the open.
- Traders should consider waiting for 6-12 bars before placing a trade unless they are comfortable making quick decisions since most breakouts on the open fail.
- Traders should pay close attention to the day’s open as the bulls will want a close above it.
Yesterday’s Emini setups

Al created the SP500 Emini charts.
Here are reasonable stop entry setups from yesterday. I show each buy entry bar with a green arrow and each sell entry bar with a red arrow. Buyers of both the Brooks Trading Course and Encyclopedia of Chart Patterns have access to a near 4-year library of more detailed explanations of swing trade setups (see Online Course/BTC Daily Setups). Encyclopedia members get current daily charts added to Encyclopedia.
My goal with these charts is to present an Always In perspective. If a trader was trying to be Always In or nearly Always In a position all day, and he was not currently in the market, these entries would be logical times for him to enter. These therefore are swing entries.
It is important to understand that most swing setups do not lead to swing trades. As soon as traders are disappointed, many exit. Those who exit prefer to get out with a small profit (scalp), but often have to exit with a small loss.
If the risk is too big for your account, you should wait for trades with less risk or trade an alternative market like the Micro Emini.
EURUSD Forex market trading strategies
EURUSD Forex daily chart
- The EURUSD went below the low of two days ago today, creating a second leg down.
- The odds favored a second leg down after the 5-bar bear microchannel.
- However, yesterday was a bad Low 1 with a bull signal bar. This increased the odds of buyers below and the market going more sideways than down.
- While the bears have done a good job, the market is probably going to bounce for a couple of days. There are probably sellers above. However, they may not come in until the midpoint of the recent selloff down to the January low.
- Overall, traders should expect the bears to become disappointed at this price level.
Summary of today’s S&P Emini price action

Al created the SP500 Emini charts.
See the weekly update for a discussion of the price action on the weekly chart and for what to expect going into next week.
Trading Room
Al Brooks and other presenters talk about the detailed Emini price action real-time each day in the BrooksPriceAction.com trading room days. We offer a 2 day free trial.
Charts use Pacific Time
When times are mentioned, it is USA Pacific Time. The Emini day session charts begin at 6:30 am PT and end at 1:15 pm PT which is 15 minutes after the NYSE closes. You can read background information on the market reports on the Market Update page.


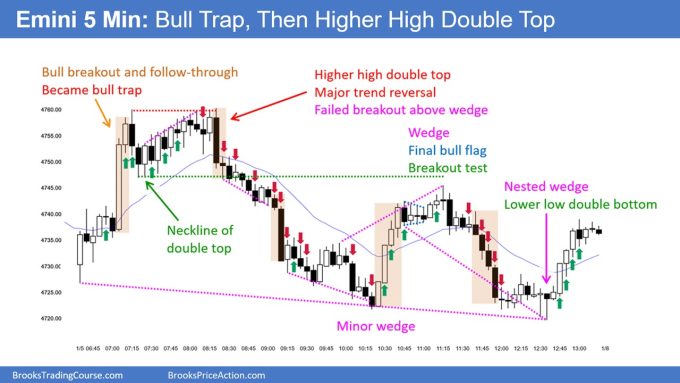
Looks good for calling the bull trap. The neckline of the DT happened to be the 50% of the BO bar. The BO bar was a BO of a bear trend line on the 4h chart. It touched the 4h MA. The MTR bear signal bar happened to make the morning swing trade.
Hi Brad, love all your daily analysis.
When you say “moving average” you don’t mention a time frame. What time frame are you referring to?
The daily 20 MA
The default moving average is the 20 period exponential moving average for whatever time frame the chart is using. Sometimes an EMA for higher time frames will be added on intraday charts. For example Brad adds the 221 period EMA on his 5 minute charts which closely simulates the 20 period EMA of the 60 minute chart.
Thanks Andrew…