Emini buy climax waiting for October earnings reports
Updated 6:45 a.m.
The Emini gapped down below the bull channel. The channel is probably evolving into a trading range. While the bulls tried for an opening reversal up from the 60 minute moving average, the 1st 2 bars were dojis. These are trading range bars. In addition, they are in the middle of yesterday’s range. The odds are against a strong bull day. While a big bear day is possible, most bull trends usually transition into a trading range first. Therefore a trading range is more likely.
Reversals after bull channels usually try to test down to the bottom of the channel. That is Friday’s higher low, which is just below yesterday’s low.
The Emini is currently Always In Short. Yet, unless there is a strong series of trend bars up or down, the odds favor a trading range day.
Pre-Open market analysis
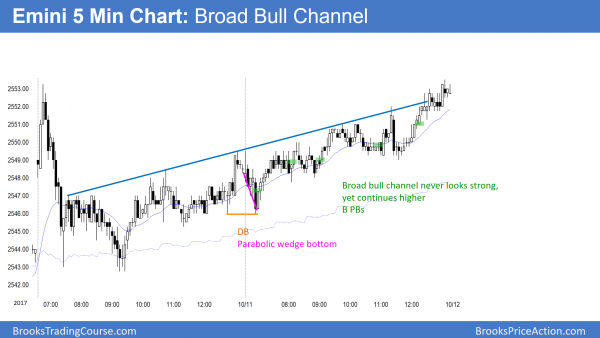
Yesterday was a broad bull channel, which often lasts 3 or more days. There is also an increased probability (40%) of a strong bull breakout above the channel. Since channels usually evolve into trading ranges and contain trading ranges, the odds favor mostly trading range trading again tomorrow.
Overnight Emini Globex trading
The Emini is down 5 points in the Globex market. Since the day session has been in a broad bull channel, the odds favor a bear break below the channel and the evolution of a trading range. That would be a continuation of the 5 day tight trading range. While a strong breakout up or down can come at any point, the odds favor another day with mostly trading range trading.
Because the weekly and monthly charts are historically overbought, there is an increased risk of a series of big bear days beginning at any time.
Yesterday’s setups
Here are several reasonable stop entry setups from yesterday. I sometimes also show limit order entries and entries on the close of bars.
EURUSD Forex market trading strategies
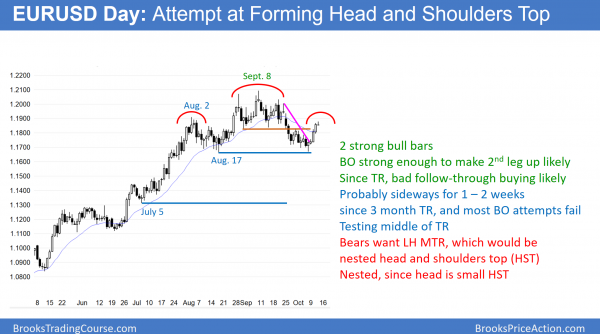
The EURUSD Forex chart rallied strongly from just above the August 17 low. This is a double bottom, but is it also a bull leg in a trading range. The bears want a lower high and then a strong break below the trading range. That would trigger a head and shoulders top.
The EURUSD daily Forex chart has been in a trading range for 3 months. It rallied strong from the bottom of the range for 4 days. In addition, the past 2 days were big bull trend bars closing on their highs. This makes it likely that the bulls will buy the 1st 1 – 3 day pullback. Therefore, at least a small 2nd leg up is likely.
A trading range usually has a series of 2 legs up and down. This one has been doing that. However, trading ranges resist change, That means that strong legs up and down end up disappointing traders because they reverse instead of leading to a trend. Until there is a breakout, there is no breakout. Strong legs up and down are more likely to reverse than grow into a trend.
Daily chart likely to continue sideways for several weeks
The bulls need a strong breakout above the top of the range. Since the top of the range is at the bottom of a 10 year trading range, it is more likely that the next attempt at a bull breakout will fail. This would create a double top. Trading ranges usually have some kind of double top and double bottom. This one has a double bottom. If the rally turns down from the high, the double top would be close to perfect. If it turns down from a lower high, it would still be a double top. However, most traders would it a head and shoulders top.
Bull trend on weekly chart
The rally on the weekly chart is in a tight bull channel. It has been above the 20 week exponential moving average for more than 20 weeks. Therefore the bulls have been so eager to buy that they have been paying more than an average price. They will therefore be eager to buy down at the average price, which is just below the 3 month range. Consequently, there are buyers below the head and shoulders top on the daily chart. This reduces the chances of a big move down over the next several weeks.
However, the weekly chart fell in a 5 bar bear micro channel (each high is below the high of the prior bar). This is strong enough selling to make the 1st rally likely to fail. Hence, bears will sell above last week’s high, and the trading range will add more bars.
Since the year long rally has been strong on the monthly chart, even if the bears get a reversal down on the daily chart, bulls would buy it. The selloff would then likely forma an even bigger trading range. This is true even if the daily chart falls for a measured move down from the head and shoulders top. For the bears to get a reversal down on the monthly chart, they will probably need several more sideways bars (months) to create selling pressure.
Overnight EURUSD Forex trading
The 5 minute chart sold off 40 pips overnight. Since trading ranges disappoint bulls and bears, the odds are against the bulls having a 3rd consecutive bull trend day. However, the channel up on the 60 minute chart has been tight. Therefore the odds are against a reversal down. Therefore, the 5 minute chart will probably be in a trading range today.
Summary of today’s S&P Emini futures price action and what to expect tomorrow
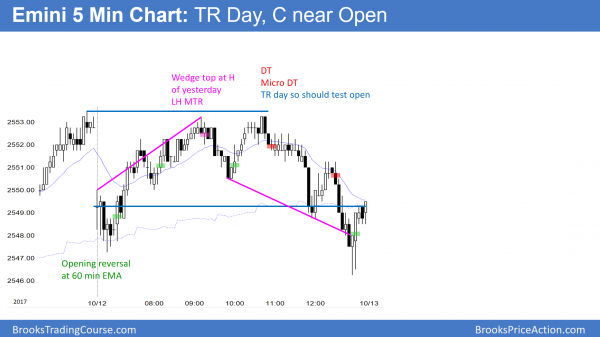
Today was a trading range day that closed at the open. It was therefore a doji bar on the daily chart.
Today broke below a 2 day bull channel and was therefore likely to be a trading range day. It was. Tomorrow is Friday so the open of the week will be a magnet at the end of the day.
See the weekly update for a discussion of the price action on the weekly candlestick chart and for what to expect going into next week.
Traders can see the end of the day bar-by-bar price action report by signing up for free at BrooksPriceAction.com. I talk about the detailed S&P Emini futures price action real-time throughout the day in the BrooksPriceAction.com trading room. We offer a 2 day free trial.
When I mention time, it is USA Pacific Standard Time (the Emini day session opens at 6:30 am PST, and closes at 1:15 pm PST). You can read background information on the intraday market reports on the Intraday Market Update page.


